Automated Data Analysis
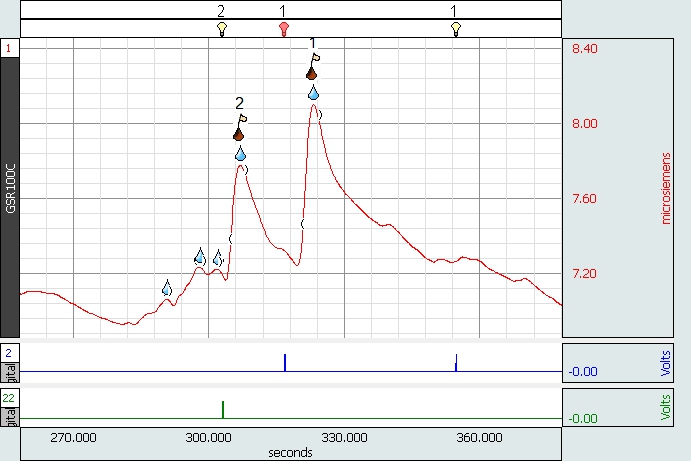
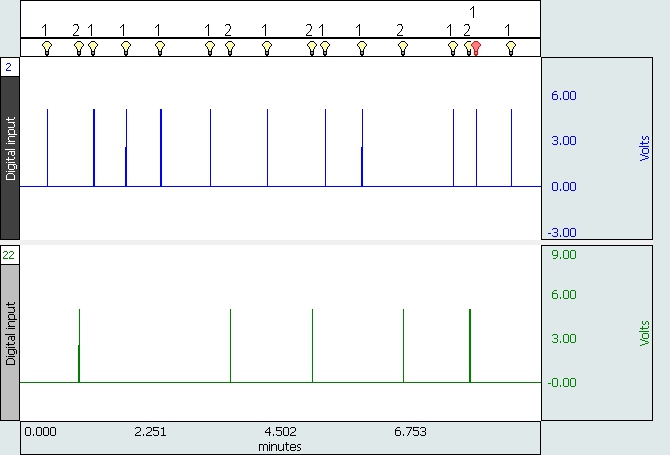

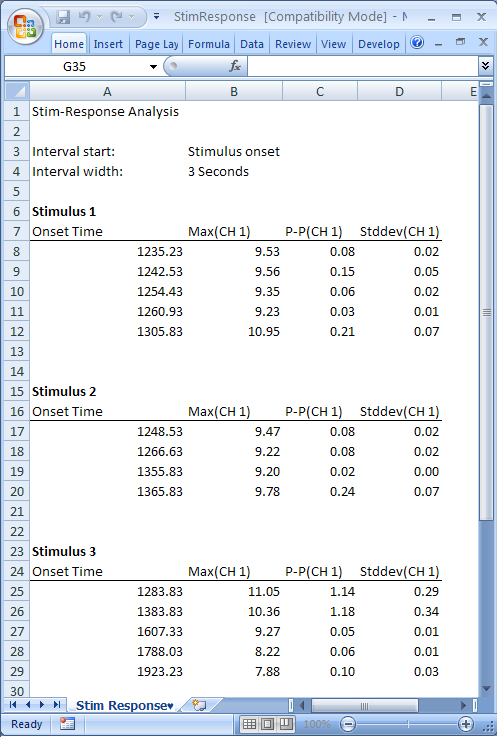
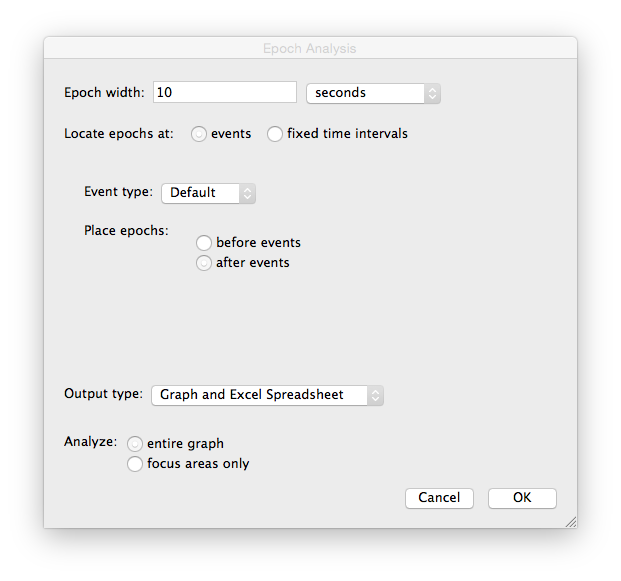
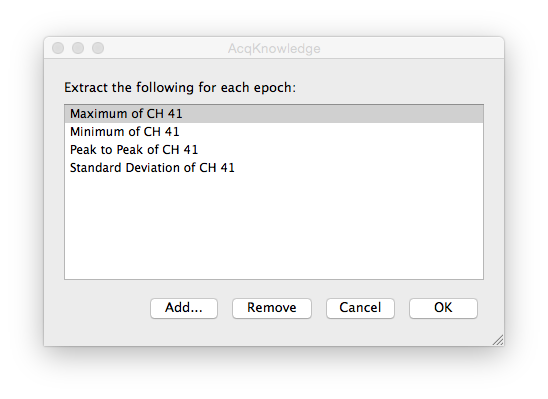
There are a variety of tools for measuring response times and response amplitudes. Perform measurements manually by selecting an area of data, or automatically over specified time periods or around the time of a trigger (pre- and post-trigger values). Measurement results can be automatically entered into a journal file for further analysis or displayed as a new graph channel. Advanced data reduction features perform automatic statistical measurements and multiple display modes allow users to view the data in a familiar format.
Details
Support
Application Notes
- 127 - Precision Force Transducers
- 101 - Transducer Calibration and Signal Re-Scaling
- 114b - Pneumotach Transducer - TSD107B
- 130 - Noninvasive Blood Pressure Measurement - TSD120
- 132 - Variable Force Transducer- TSD105A
- 135 - Pneumotach Transducer - TSD117
- 140 - Goniometers: Angular Measurements
- 141 - Tri-axial Accelerometer Calibration - TSD109 series or SS26/27
- 145 - Respiratory Effort Transducer - TSD101B
- 154 - High Level Transducer Connections - HLT100C
- 159 - Hand Switch and Foot Switch - TSD116 Series
- 186 - Variable Assessment Transducer - TSD115
- 224 - Noninvasive Blood Pressure System Calibration - NIBP100A
- 103 - Remote Monitoring System - TEL100
- 109 - 3-, 6-, and 12-Lead ECG
- 110 - Amplifier Baseline Offset Adjustment
- 126 - Wireless Remote Monitoring - TEL100C-RF
- 136 - Battery Pack Instructions - BAT100
- 149 - O2100C Module Setup for the MP System
- 151 - CO2100C Module Setup for the MP System
- 160 - Gas Analysis Module Response Time
- 162 - Stimulation Features of MP160/150/100 Systems
- 170 - Laser Doppler Flow Module - LDF100C
- 175 - Stimulus Isolator Guidelines - STMISOC
- 184 - Interfacing Millar Mikro-Tip Catheters With MP Research Systems
- 185 - iMac and G3 Compatibility Issues
- 187 - Electrodermal Response Guidelines - EDA100C (GSR100C)
- 190 - Micro-Electrode Amplifier Guidelines - MCE100C
- 195 - MP System Data Sampling Reference
- 196 - Cardiac Output Measurement - EBI100C
- 206 - Continuous 12-Lead ECG
- 207 - UDP Install: MP150 + No Network Access
- 208 - UDP Install: MP150 + Domain Network Access
- 209 - UDP Install: MP150 + Network Access or Multiple Computers
- 215 - Noninvasive Cardiac Ouput - NICO100C
- 223 - Physiological Measurement in Magnetic Resonance Imaging Systems
- 105 - Auditory Brainstem Response (ABR) Testing
- 111 - Nerve Conduction Velocity
- 115 - Hemodynamic Measurements
- 118 - EMG Frequency Signal Analysis
- 120 - X/Y Loop Area Analysis
- 121 - Waveform Data Reduction
- 122 - Power Spectrum Analysis
- 129 - Heart Rate Variability
- 131 - Averaging Mode in the MP System
- 142 - Rate Detector Algorithm in AcqKnowledge
- 143 - Importing AcqKnowledge Data Into Excel
- 148 - Automated ECG Analysis
- 150 - O2100C Module for Oxygen Consumption
- 152 - CO2100C Module Application Example
- 155 - AcqKnowledge File Formats for the Macintosh
- 156 - AcqKnowledge File Formats for PC With Windows
- 158 - Analyzing Inspired & Expired Lung Volume
- 161 - Automated Tissue Bath Analysis
- 168 - Analyzing Intraventricular Pressure Wave Data (LVP Analysis)
- 169 - Speech Motor Control
- 171 - New Features of AcqKnowledge v3.5 for Windows 95, 98, and NT
- 177 - ECG Analysis Using the Offline Averaging Mode
- 182 - Analysis of Blood Flow Data
- 183 - VO2 and RER Measurement
- 191 - Digital I/O Channels
- 197 - New Features of AcqKnowledge v3.5 for Macintosh USB
- 198 - Prepulse Inhibition of Startle
- 199 - Impedance Cardiography and Pre-ejection Period
- 200 - Creating Arbitrary Waveforms for the MP Systems Stimulator
- 201 - SuperLab With AcqKnowledge
- 204 - AcqKnowledge Peak Detector Operation
- 211 - EEG Analysis With AcqKnowledge
- 210 - New Features for AcqKnowledge v3.7 for Mac
- 214 - EMG Startle Scoring for Prepulse Inhibition Studies
- 216 - Electrodermal Activity (EDA/GSR) Scoring Methods
- 218 - Hardware API
- 219 - Known Issues - AcqKnowledge
- 221 - Simplified VO2 Measurement (Without CO2 Values)
- 115 - Hemodynamic Measurements with BSL PRO
- 116 - Hemodynamic Measurements - Part 2
- 117 - Pulse Transit Time and Velocity Calculation
- 118 - EMG Signal Analysis
- 148 - Automated ECG Analysis - BSL
- 158 - Analyzing Inspired & Expired Lung Volume - BSL
- 161 - Automated Tissue Bath Analysis - BSL
- 165 - Integrated EMG
- 166 - Upgrading From BSL PRO 2.xx to BSL PRO 3.0
- 167 - Upgrading From Biopac Student Lab 2.xx to 3.0
- 168 - Analyzing Intraventricular Pressure Wave Data (LVP Analysis) - BSL
- 180 - BSL PRO v3.6 Software Changes
- 181 - Producing an Integrated Airflow Signal
- 217 - Importing BSL PRO Data Into Excel (or other spreadsheet programs)
- 130 - Blood Pressure Measurement for the BSL PRO
- 132 - Variable Force Transducer - SS12LA
- 135 - Airflow Transducer Calibration - SS11LA
- 140 - Goniometers: Angular Measurements
- 141 - Tri-Axial Accelerometer Calibration - BSL
- 144 - Hand Dynamometer Calibration - BSL
- 172 - Multilead ECG Cable - SS29L
- 173 - Electronic Stethoscope Transducer - SS30L
- 179 - Interfacing Narco Myographs to Biopac Student Lab
- 222 - Pseudorandom Stimuli Following Stimulus Presentation
- 102 - Biopotential Amplifier Testing With CBLCAL
- 117 - Pulse Transit Time and Velocity Calculation
- 227 - Biopac Student Lab Publications
- 300 - Line In Audio Adapter Compatibility
- 230 - Connections for Physiological Signals in an MRI
- 231 - NIBP100B-R Calibration
- 232 - EMG: Normalize to Maximum Voluntary Contraction
- 232 - EMG: Normalize to Maximum Voluntary Contraction - BSL PRO
- 233 - Heart Rate Variability - Preparing Data for Analysis
- 234 - Virtual Reality / Immersive Environment
- 235 - Zygomaticus Measures with Pressure Pad vs. EMG in MRI or fMRI
- 004 - MP150 Firmware Compatibility
- 001 - AcqKnowledge Release and OS Compatibility
- 002 - BSL Release and OS Compatibility
- 003 - BScL Release and OS Compatibility
- 231 - NIBP100B-E Calibration
- 238 - Software options for controlling the SDS100 Scent Delivery System
- 239 - Send to AcqKnowledge from Vizard via parallel port
- 240 - Measurement Computing card setup
- 241 - Recording EMG data in an fMRI
- 242 - Recording ECG Data in an fMRI
- 243 - Gated Analysis for Data Recorded in an MRI - EMG example
- 245 - DTU200 Dual Channel Gating Setup and Operating Instructions
- 246 - R-R Interval Processing with the BIOPAC HRV Algorithm
- 249 - Online Averaging Latency Parameters
- 250 - Assess Muscle Effort with Vibromyography
- 251 - n-back for fNIR with AcqKnowledge
- 252 - Aerobic Capacity, Physical Fitness and VO2 Max
- 253 - BBS | Getting Started with BIOPAC Basic Scripting
- 255 - Artifact Rejection: Verification Procedure (MP150 System)
- 256 - BBS | Video Scoring with BIOPAC Basic Scripting
- 257 - Safe Use of Electrical Stimulators
- 258 - BIOPAC MRI Smart Amplifier Performance
- 259 - ECG Averaging in the MRI using the ECG100C-MRI amplifier
- 260 - Using Vibromyography to obtain length-tension curves for the quadriceps muscles
- 261 - TSD250 (BPS-II) VMG transducer in the assessment of isometric absolute muscle effort
- 262 - VMG to assess quad-hamstring activity after ACL tear
- 263 - Strategies to Record Biopotential or Transducer Data in MRI or fMRI
- 264 - BBS | Scripting: Flow Control via Graph File UI
- 265 - MRI Artifact Removal from ECG Waveforms
- 266 - Tri-axial Accelerometer Measurements using BioNomadix
- 267 - Wireless Noninvasive Cardiovascular Reactivity Measurement
- 268 - Metabolic Analysis Systems and Propane-based Verification
- 270 - Synchronizing Physiology Data Recording with Associated Video
- 271 - Synchronizing B-Alert and MP150 on separate computers
- 273 - Use BioNomadix Accelerometer as Tilt Sensor or Inclinometer
- 275 - Dynamometers for Low Hand Grip Strength Measurements
- 276 - Emotional State (Affect) Recognition via Physiological Measures & Processing
- 277 - Transcranial Current Stimulation Using STMISOLA
- 278 - Percent End Tidal CO2 Measurement using C02100C
- 279 - ECG and EDA Recording in 7-Tesla fMRI
- 280 - ETHUSB Communication - Mac OS X 10.7 or above
- 281 - ECG Timing Delay Associated with Amplifier Filter Selections
- 282 - Subject Electrical Stimulation in fMRI and MRI
- 283 - fMRI Imaging Sequencing Effects upon Physiological Measurement
- 284 - fNIR Systems – Dark Current Measurements
- 285 - Identifying Stimulation Threshold
- 286 - NIBP100D Calibration
- 287 - MP3x Drivers in Mac OS 10.13
- 288 - How to Turn Events into Graph Channels
- 290 - BBS Feedback Control
- 291 - BBS Pulse Amplitude Feedback
- 292 - Interfacing with E-Prime®
- 293 - Displaying BPM Through Seven Segment Displays
- 294 - Trans-radial Electrical Bioimpedance Velocimetry (TREV and TRUEV)
- 296 - Continuous Monitoring of a Monotonic Signal for GASSYS3
- 244 - Programmable Stimulator for E-Prime®
- 298 - Getting Started with Workflow
Knowledge Base
- Arbitrary waveform stimulation
- Grounding guidelines
- Gel for EDA (GSR)/SCR
- Recording good data
- AcqKnowledge backwards compatibility
- Extracting data segments from a file
- Text files - import and export
- Electrodermal activity measurements
- MRI - Triggering
- Volume from airflow
- Interfacing third-party amplifiers
- Railing signal (flatline)
- NIBP100A sensor height & signal output
- Buffer overflow
- Extracting heart rate from a noisy ECG signal
- AC mode
- DC mode
- Low pass filters
- High pass filters
- Band-pass and band-stop filters
- Notch filter
- Amplifier filter settings
- Calibration values
- Common mistakes/general troubleshooting
- Deep breath and SCR/EDA increase
- Reusable vs. disposable EDA/GSR electrodes
- IIR vs. FIR filters
- Deep breath and PPG signal flattening
- EEG reference - linked ears, summed ears, etc.
- Maximum number of channels for EEG
- Ground vs. reference for EEG recording
- Bipolar EEG
- VREF, reference excitation voltage
- Editing noisy data
- * CLEANING GUIDELINES *
- Calculating file sizes
- Using other software with BIOPAC hardware
- AcqKnowledge accuracy
- Interfacing third-party transducers
- Amplifier analog output signals
- ECG R-wave detector
- ECG Analysis
- Interface with visual presentation programs
- Upgrading from PCMCIA to USB
- Combining Video with AcqKnowledge
- LabView interface
- USB Drivers and Controller Communication
- EEG frequency bands
- NIBP100A and pulse plethysmography
- Outputting a signal through the STM100C
- Visual presentation system triggering the MP150/100
- MP150 UDP protocol fixed IP address
- Biopac Science Lab - System Check Troubleshooting
- Electrode Check on older MP36 and MP35
- Duplicating waveforms
- Electrical stimulation and artifact
- MP System Comparison: MP150 vs. MP100
- Amplifier conversion - 2 mm to touchproof
- Amplifier baseline offset adjustment
- Biopotential amplifier signal validation
- DA100C amplifier signal validation
- Electrode Properties - gel and adhesive
- Biopac Science Lab Line In Ports
- EDA (GSR) subject preparation
- Disc I/O error 5000
- Guidelines - EDA, EDR, GSR, SCL, and SCR
- AFT11 Series coupler guide
- Clinical chart grid setting for ECG
- CAP100C electrode connections
- PPG setup and calibration
- National Science Education Standards Correlation
- GLP Lab Assistant - Good Laboratory Practice
- MP150 Firmware Compatibility
- ECG artifact in EMG Signal
- Differences between the NICO100C and EBI100C
- MRI, Radiotranslucent, and Radio-opaque Compatibility
- Section 508 Compliance
- BSL PRO optimize range
- Compatibility: OS & Computer Requirements
- Magnetic stimulation artifacts
- Optimal ground placement
- Respiration recording
- Negative EDA (GSR)
- Loading Physiobank data files
- Audio recording synchronization
- SuperLab troubleshooting
- Screenshots in BIOPAC software
- QRS Amplitiude & Respiratory Modulation
- Inverted Waveform
- Calibration in Volts, Millivolts, Microvolts
- FIR Filter - AcqKnowledge 3.9.2 (Mac)
- MP40 sample rates
- Nerve Chamber to MP1XX System
- Gould interface
- FIR issue - AcqKnowledge 3.9.x for Mac
- EOG vs. EMG amplifier
- MP3X Filters
- External Devices and Channel Contention
- Multiple amplifiers per subject or multiple subjects per system
- NIBP100C Calibration Values
- NIBP100A single pulse data analysis
- EDA / SCR offset calibration for MRI
- Connecting the TSD116C Switch Box
- Copy and paste append markers along with data
- Lab or Room Electrical Considerations for an MP system
- AcqKnowledge 4 and Windows XP
- Artifact Rejection verification procedure
- fNIR FAQ
- Discontinued Items
- EMG - underwater measures
- BIOPAC Basic Scripting - available scripts
- Calculation Channel Scaling (i.e. Expression Evaluator)
- Tutorial Electrostatic Discharge
- Exporting Data to SPSS
- Amplifier module filter response times
- Glossary of specification terminology
- BioHarness data logging with Windows 8
- AcqKnowledge: Newest Features
- AcqKnowledge License Key Registration and Replacement Options
- Routing TTL pulses out of the STP100C BNC connector
- AcqKnowledge iLok USB Key Issues
- Exporting Event Labels into MATLAB
- Guidelines for Psychophysiological Recordings
- Galvanic Isolation Guidelines for MP Research Systems
- ETHUSB Ethernet not communicating on Mac OS X 10.7 or above
- Resting Heart Rates
- BioHarness pairing with BT
- Physiological measurements - life science signals using BIOPAC
- Missing Lessons in Startup Wizard | Biopac Student Lab
- Unable to establish communication with any data acquisition hardware
- How do I set up my equipment?
- How come the "start" button in my software is grayed out and unusable?
- Where do I place electrodes/sensors/transducers?
- How should I prepare electrode sites?
- What types of electrode should I use?
- How do I sync my stimulus presentation software with my data acquisition software?
- How do I calibrate my data hardware?
- How come when I try to record data all I see is a flat line?
- Can I get the MSDS for electrode gels?
- How do I calibrate my data software?
- How can I determine which software versions are compatible with which operating systems?
- Installation CD/DVD lost or damaged...how can I re-install software?
- Single user license
- Invisible channel changes
- No cycles found
- Data export to spreadsheet
- Exchanging files
- Computing heart rate
- Unexpected HRV results
- HRV meaning
- Stroke volume
- Volume calculation
- Flash player installation
- Signal inversion
- Unipolar-EEG
- Phasic EDA: Methods for computing phasic skin conductance from tonic
- Electrode tape for cardiac output measurements
- BioNomadix Signal Interruption
- Measuring respiration from impedance (ICG) data
- MRI Data Cleaning | PhysIO Toolbox to Remove Image Artifact
- - Top 10 Knowledge Base Queries
- Height/Weight entries for CO using Kubicek/Rho method
- B-Alert Gauges Unresponsive
- B-Alert “Use B-Alert Definition File” generates error
- AcqKnowledge iLok key lost or unavailable
- How can I obtain the mean amplitude of SCRs in a given area of a graph?
- Excel files exported from BIOPAC software open in Excel 'Protected View'
- BioNomadix Transmitter Battery Level
- Connecting Calibration Gas Tanks & Mixing Chambers
- Troubleshooting MP160 Ethernet Communication
- How can I move QRS peak event marks from the bottom of S waves to the top of R waves?
- Enabling the Transform Menu in BSL Analysis (RSD)
- Event Markers | Correcting Automated Placement
- MRI Recording Physiology Data | Recommended Readings
- How to cut a TSD147A and TSD147AL single fiber
- About License Keys
- Bioimpedance Methods
- HMD Plus Sensors for fNIRS and/or B-Alert
- Biopac Student Lab (BSL) Newest Features
- Checking Finger Cuff Lifetime for NIBP100D/NIBP100D-HD
WHAT'S NEW
Speech and communication are integral parts of human relationships and development As such,...
Stay Connected