288 – How to Turn Events into Graph Channels
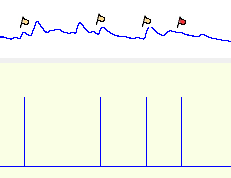
This application note explains how AcqKnowledge 5 features can be used to plot event markers in a graph channel, where spikes indicate where events are located. Settings for the Find Cycles analysis routine are detailed for Cycles/Peaks, Selection, and Output tabs.
This process can be useful for exporting data or to save from AcqKnowledge 5 to an earlier version without losing event data. 
Associated Applications
- Psychophysiology - Record and analyze BP, ECG, HRV, EDA, EMG, EEG, EOG, RSP, etc. Interface to stimulus presentation programs...use automated analysis routines to easily score and analyze data.
- Exercise Physiology - Examine ventilation, oxygen uptake, carbon dioxide production, biopotentials, temp., and biomechanical signals simultaneously. Record wirelessly with BioNomadix.
- EOG: Eye Movement - Record eye position and movement with the EOG100C amplifier. Find frequency, distance, velocity, and point of focus. Isolate behavior associated with nystagmus and saccades.
- Eye Tracking -
WHAT'S NEW
Speech and communication are integral parts of human relationships and development As such,...
Stay Connected