QRS Amplitiude & Respiratory Modulation
MODULATION OF QRS AMPLITUDE
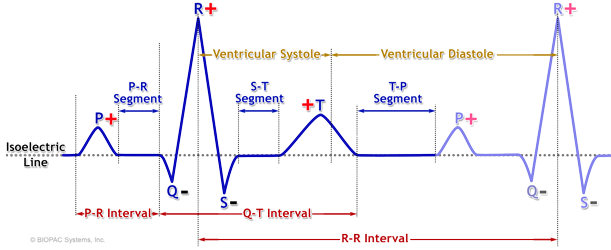
Several anatomical and physiological factors determine the amplitudes of the Q, R, and S waves in the ECG of a normal person. These factors include the physical mass of the heart (particularly the left ventricle), the path the electrical current takes as it spreads from the AV node through the conduction system of the ventricles, the position of the recording and ground electrodes on the skin surface, and the position of the heart with respect to the positive (+) and the negative (-) electrodes.
During one cardiac cycle, electrical current flows from the SA node through the atria to the AV node, and then from the AV node through the AV bundle, bundle branches, and Purkinje fibers to ventricular muscle. The preponderant direction and magnitude of current flow varies from moment to moment, and at any given moment can be expressed as a vector. All of the individual momentary vectors measured during the spread of current through the ventricular conduction system during one cardiac cycle can be summed and expressed as a single resultant vector.
Request an ECG Recording & Analysis Demo How to Record Great ECG | Tips to Get Clean, Usable Data
The direction of the resultant vector with respect to a horizontal line (180°- 0°) running through the base of the heart is known as the mean QRS axis, or the mean electrical axis of the ventricles. The magnitude of the resultant vector, measured in millivolts, is known as the mean QRS potential, or the mean ventricular potential. In the frontal plane, the mean QRS axis is typically between 0° and +90°, usually around +50°. The anatomical axis of the adult heart is around +55°, meaning the apex of the heart points to the lower left rib cage. The electrical axis of Lead II is +60°, therefore both the anatomical axis of the heart and the mean electrical axis of the ventricles are usually close to the electrical axis of Lead II.
Note: To simplify this discussion
- The dominant positive R wave is discussed; the Q wave and S wave are not discussed. In the bipolar limb leads (Lead I, Lead II, and Lead III), the Q wave and the S wave are usually negative and low-amplitude compared to the dominant positive R wave.
- Lead II (right arm (-), left leg (+), right leg (gnd)) is used for explanatory purpose; other standard electrocardiographic leads are not discussed.
In electrocardiography, electrical current flowing toward a positive electrode results in a positive (upright) waveform display. Electrical current flowing away from the positive electrode results in a negative (downward) waveform display. In Lead II, the R wave is therefore positive. If a positive electrode is placed on the right 4th intercostal space and a negative electrode is placed on the left mid-clavicular line, a lead arrangement designated MCL1, the R wave becomes inverted (negative) because the current is now flowing away from the positive electrode.
The amplitude and direction of the R wave depends on the “electrical picture” the recording electrodes “see” as current spreads through the ventricular conduction system. The closer the mean QRS axis is to the electrical axis of Lead II, the larger the amplitude of the R wave. This means that if the anatomical axis of the heart, in other words the position of the heart in the chest, were to shift toward or away from the electrical axis of Lead II, the amplitude of the R wave would increase or decrease.
The size, shape, and position of the heart may vary from individual to individual, and also from time to time in the same individual. The variations are related to body type (tall and slender vs. short and stocky), age, posture (prone, supine, sitting or standing), and respiration (quiet respiration vs. deep inspiration and expiration).
The position and movements of the diaphragm determine the position of the heart because the pericardium is firmly attached to the central tendon of the diaphragm. With deep inspiration, the diaphragm contracts and becomes flatter and less dome-shaped. As it does, the heart descends, moves backward, and rotates to the right so that it becomes narrower and more vertical. The apex beat is lower and more medial. During deep expiration, the diaphragm relaxes, elevates, and becomes more dome-shaped, and movements of the heart are the converse of those that occur during deep inspiration. The degree of the directional movements of the heart during quiet breathing is similar but reduced compared to deep breathing and, in some persons, may be hardly noticeable.
Thus, diaphragmatic breathing cyclically affects the position of the heart with respect to the position of the electrodes on the skin, causing the “electrical picture” the recording electrodes “see” to change, and along with it, the amplitude of the R wave.
Stay Connected