Respiration recording
Guidelines for obtaining better respiration data when using a respiration belt transducer
Avoid noise in the first place
- Set the RSP100C amplifier to the recommended settings for general respiration recordings:
- Gain: 10
- LP filter: 1 Hz
- HP filter (top switch): DC
- HP filter (bottom switch): 0.05 Hz
- Ensure the respiration belt transducer is disconnected from the amplifier.
- Press Start in the software to begin recording.
- When the signal has stabilized, usually after about 30 seconds, check the signal.
- If the signal is not close to 0 volts, adjust the ZERO screw on the front of the amplifier; turn clockwise to move the signal up and counterclockwise to move it down.
Properly use the Respiration Belt Transducer
A good signal requires proper attachment of the belt to the transducer and the transducer to the subject.
Respiration Belt Attachment
-
- Run the strap through the side buckles on the transducer, with the self-adhering (Velcro® style) side of the strap up.
- Flip the tip of the strap back over the buckle so it adheres to the rest of the belt.
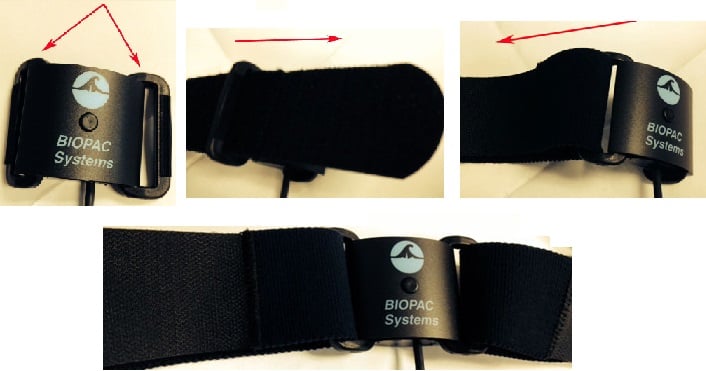
Respiration Transducer placement
-
- Have the subject exhale completely, then tighten the respiration belt around the abdomen/chest.
- The belt should not be in any way loose around the subject’s body at the point of complete exhalation.
- Observe or ask the subject whether she breathes primarily with her stomach or chest.
- The respiration belt should be placed accordingly to maximize sensitivity.
- Minimize subject movement and, if appropriate, talking on the subject’s part.
- Have the subject exhale completely, then tighten the respiration belt around the abdomen/chest.
Identify noise in the respiration data
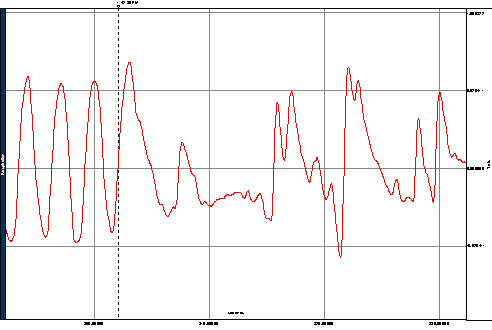
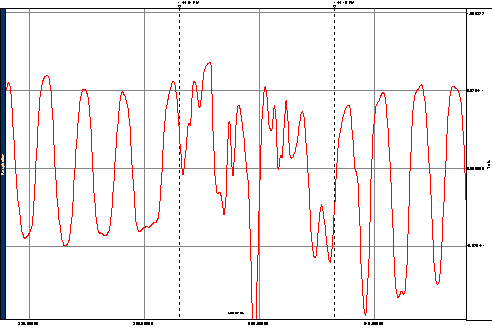
It is not always trivial to determine whether an apparent abnormality in the respiration record is physiological in nature or not. A synchronized video recording of the subject can help in the identification of artifacts like subject movement, talking (see the AcqKnowledge software guide for information on recording video with AcqKnowledge). The experimenter could also manually enter markers in the data during the experiment whenever the subject moves, talks, etc. (See the section on Markers in the AcqKnowledge software guide).
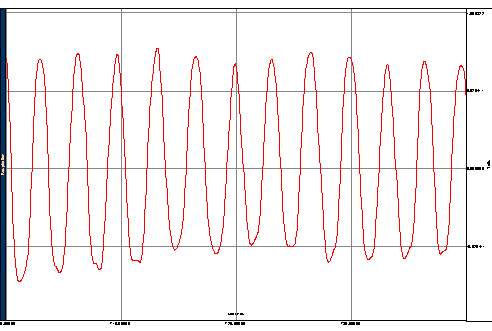
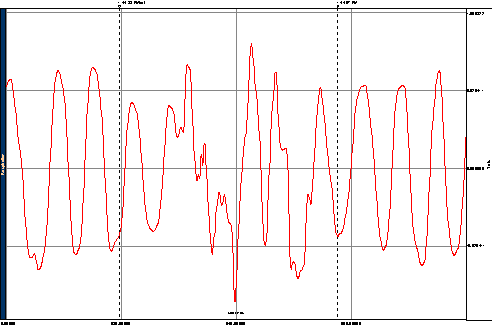
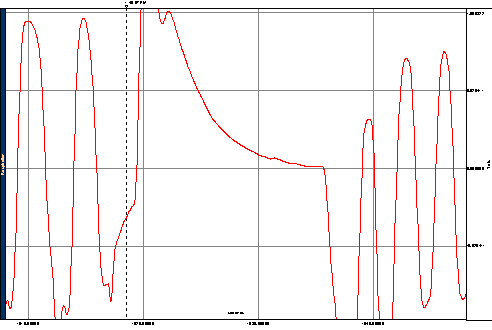
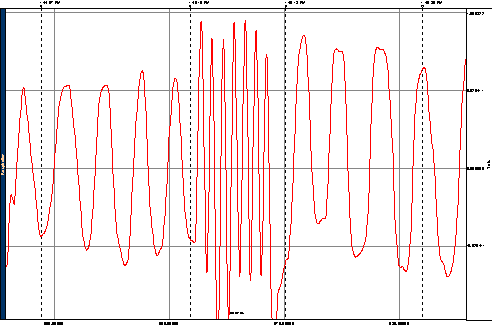
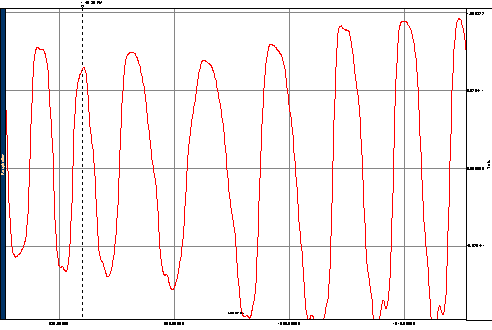
There are several potential sources of noise for respiration recordings. This is how normal data and noisy data can look (RSP100C at gain 10, HP at 0.05 Hz and DC, LP at 1 Hz; respiration sensor placement over the abdomen):
The respiration data does not need to be sampled any faster than 50 samples per second. To make the filter transformations less computationally intensive resample the respiration waveform to 50 samples per second (if the sample rate is currently higher) by going to Transform > Resample.
Apply a Bandpass FIR filter between 0.05 Hz and 1 Hz. Go to Transform > Digital filters > FIR > Bandpass and enter 0.05 for the low frequency, 1 for the high frequency and 4000 for coefficients (assuming a sample rate of 50 Hz).
The signal will be a little cleaner and centered around 0. (Display >Autoscale waveform will bring the signal into view)
Keep the respiration rate calculation as it is.
PROS: Less work intensive and if the noise is a small fraction of the data it should average out
CONS: Reducing the statistical power of your experiment or even distorting the results; need to determine how much noise is acceptable
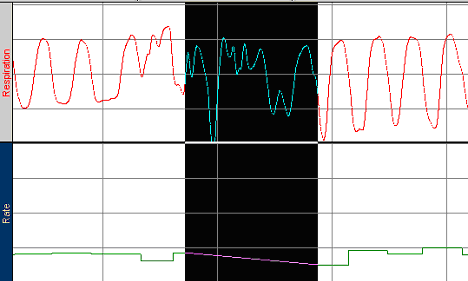
Use Connect Endpoints to interpolate over the problematic section.
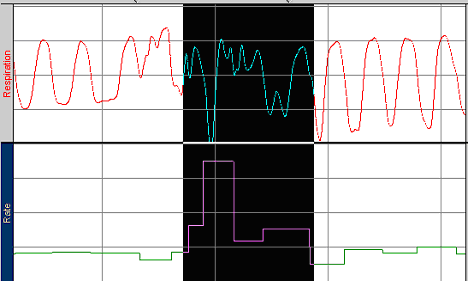
- On the rate channel, highlight from just before to right after the artifact. Go to Transform > Math Functions > Connect Endpoints.
PROS: Respiration is a slow signal and this solution will be acceptable over short periods of noise
CONS: Reducing the statistical power of your experiment or even distorting the results; need to determine how much interpolation is acceptable
Example: rate artifact before and after connect endpoints:
PROS: Ideal if the respiration cycles can still be visually identifiedCONS: Relies on human judgment to identify respiration cycles and introduces subjectivity
Stay Connected