How do I calibrate my data software?
- For comments on some specific data types, see “How do I calibrate my data (Hardware)?”
To calibrate a transducer before data are acquired:
From the perspective of software, the key issue is how to enter the one (or two) coordinates that will specify the input/output relationship. When working with transducers sold by BIOPAC, newer versions of AcqKnowledge are designed to perform these calibration steps automatically by walking the user through a series of actions that will generate relevant calibration data and store the numbers in the appropriate place. For instance, skin conductance measurements normally only require an offset correction. The software thus directs the user to obtain one data point to determine what that offset should be.
When there is no path that will allow current to flow from one electrode to the other, the conductance is physically zero. Consequently, when the device is open-circuited, the signal the amplifier is reporting should be understood to correspond to a conductance of zero micromhos. Hence when the software is told that, for instance, an EDA100C amplifier is being added to the system, the software presents a dialog:

When the user clicks the “Calibrate” button, the software takes a reading from the amplifier and maps that value to zero. In the case of this amplifier, the second value used to specify the input/output relationship is derived from the gain setting on the amplifier (which the user specified in an earlier step).
To see what the software did (what must be done by the user in older software versions), click the “View by Channels…” button in the channel setup dialog. This will generate a view similar to the only view available in older software versions:
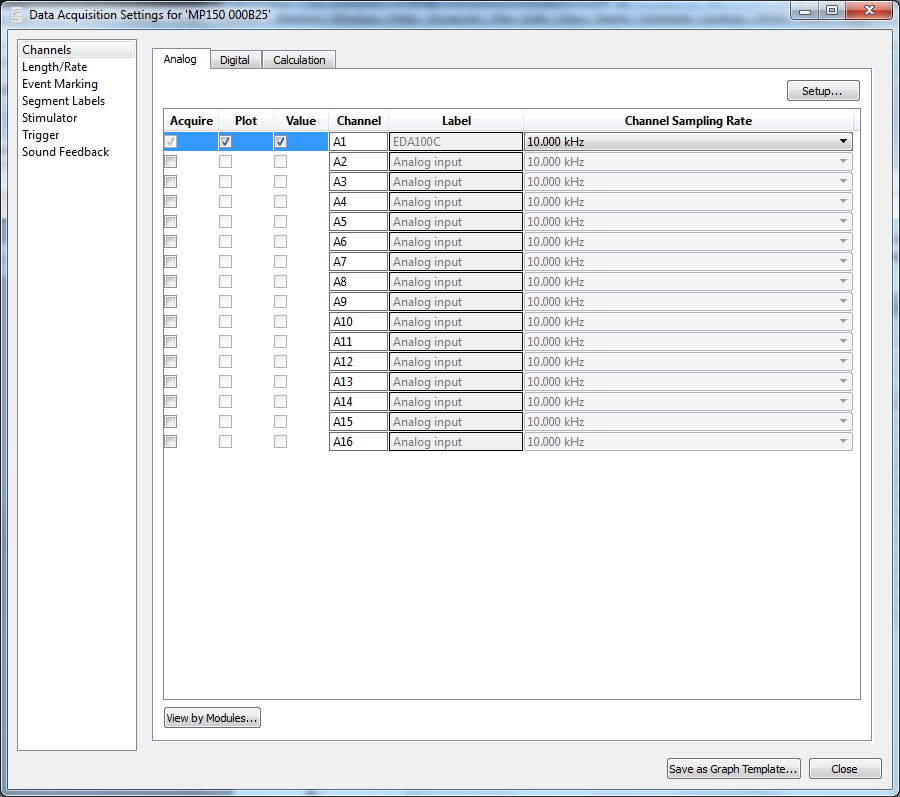
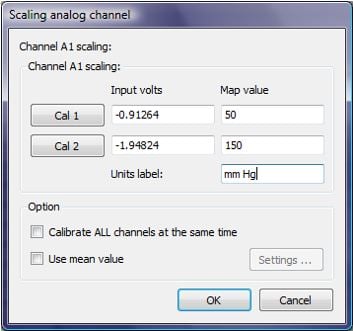
With the EDA100C channel selected, clicking the “Setup…” button opens the scaling dialog (after the software is told that the user really wants to modify the settings):
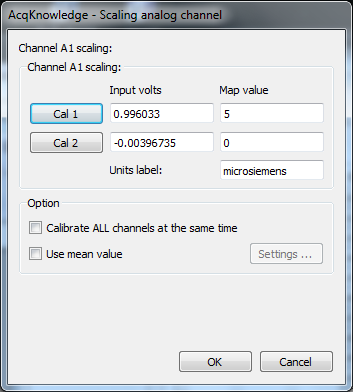
“Input volts” in the second row is the voltage that the MP150 recorded from the EDA100C at the time the user clicked the “Calibrate” button. As above, the software maps this value to a conductance of zero microsiemens. The gain setting on the amplifier was set at five micromhos per volt (micromhos and microsiemens are equivalent units). Hence the software maps a change of one volt to a change of five microsiemens (-0.00396735 to 0.996033 is a change of one volt, and zero to five is a change of five microsiemens).
To direct the software to acquire a reading from the device, the user may click either the “Cal 1” or “Cal 2” button—either causes the MP150 to obtain instantaneous data; they differ only in where the output is directed. If “Cal 1” is clicked, then the reading is placed in the “Input volts” column in the top row. If “Cal 2” is clicked, then the reading is placed in the bottom row. The values can also be edited manually.
To obtain better readings from the Cal buttons, “Use mean value” should be enabled (checked). Ths also enables the “Settings…” button, which allows the user to specify a number of data points to be collected. With “Use mean value” checked, a click of the “Cal 1” or “Cal 2” button causes the MP150 to acquire as many data samples as indicated via “Settings…” and then average them together before placing that value in the appropriate row in the Input volts column.
In a case such as skin conductance, where an offset correction is sufficient, only one of the two Cal buttons should be clicked. The other “Input volts” number should be derived from that one measurement and the gain setting of the amplifier. In the case of the EDA100C, the possible gain settings are specified as ‘x’ micromhos/volt, so the easiest way to map the second coordinate is to add one to the number measured by clicking the cal button, placing the result in the Input volts, and inserting ‘x’ from the gain setting as the corresponding Map value.
For transducers that require two measurements to specify the input/output relationship,
- expose the transducer to a known value, and click “Cal 1.”
- edit the known value into the “Map value” column in the top row,.
- expose the transducer to a second known value and click “Cal 2.”
- edit that second known value into the Map value column in the second row.
- For instance, transducers used for direct pressure measurements (e.g., TSD104A) normally require two-point calibration. If the transducer is connected to a sphygmomanometer, the bulb may be used to pump the pressure up to 40 mm Hg. The Cal 1 button may then be pressed and the value of “40” edited into the Map value column in the top row. Then the bulb may be squeezed to inflate the cuff farther until the pressure is, for instance, 140 mm Hg. Then the “Cal 2” button may be clicked and the value of “140” edited into the second row of the “Map value” column. The “Units label” should then be changed to “mm Hg” or “Torr.”
For other examples of how to obtain appropriate map values, see “How do I calibrate my data (Hardware)?” Two particular cases described there warrant further discussion in software:
Airflow transducers
Because devices that can produce known flow rates are not common, calibration of flow transducers is most easily accomplished by forcing a known volume through the sensor, integrating the sensor’s output, and determining the scale factors necessary for the volume computed in software to match the physical volume pushed through the device. This screencast demonstrates a set of steps that simplifies the necessary computations in this procedure.
Noninvasive blood pressure
“How do I calibrate my data (Hardware)?” includes steps for generating a square wave by the NIBP100D. The most effective way to make use of this square wave is to use the measurement boxes to acquire the mean value at the top and bottom of the square wave:
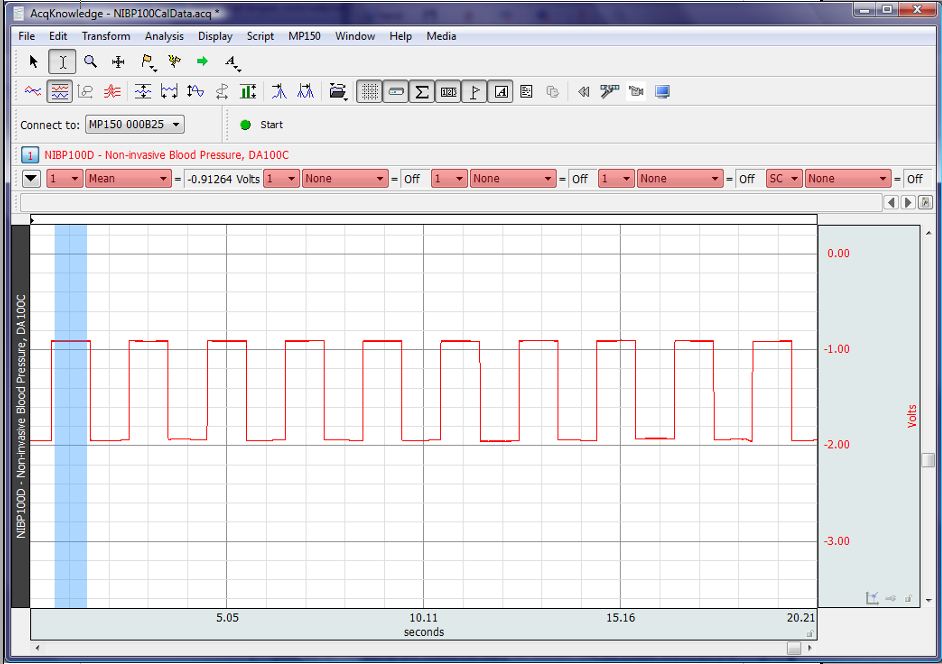
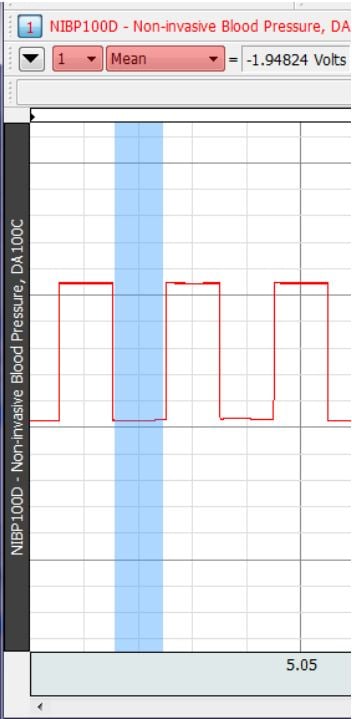
and edit those values into the appropriate locations for channel scaling:
To calibrate data after acquisition is complete:
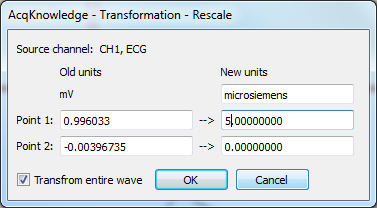
If data were acquired in a file that was not properly set up to produce calibrated data, the numbers may be adjusted post acquisition. To do this, calibration information must be obtained. The steps described above for obtaining calibration information prior to acquisition may be followed. The information may then be used by selecting the channel to be calibrated and choosing “Transform > Rescale…” The resulting dialog looks very similar to the channel scaling dialog because it serves the same purpose:
Page last modified 19Jan2015
Stay Connected