fNIR FAQ
 Q: What’s being measured?
Q: Areas potentially available for study?
Q: Placement guidelines for sensor?
Q: Strengths and limitations of fNIRS?
Q: Identify a location or activity?
Q: Protocol guidelines?
Q: Issues from perspiration? Effect when sensor saturated?
Q: Interference from Motion Artifact?
Q: Spatial Resolution
Q: Power output?
Responses
from Anna Merzagora, Kurtulus Izzetoglu, and Hasan Ayaz—Drexel University
A: BIOPAC’s fNIRS System is not an oximetry device. The device measures the changes in the concentration of oxygenation and deoxygenation with respect to one control condition. In contrast, in order to have the %O2 saturation, we would need to have the absolute amount of oxy and deoxy so as to calculate (roughly) oxy/(oxy+deoxy). Other fNIR devices that are based on slightly different concepts (e.g., those that belong the named groups of ‘Time resolved’ and ‘Frequency domain’ spectroscopy systems instead of ‘Continuous wave’ systems) can do that. However, that comes with a price…generally between $100k to $400k due to more sophisticated hardware.
Q: What areas are potentially available for study?
A: Rostrolateral Prefrontal Cortex: More precisely, the following Brodmann Areas can be monitored via the fNIRS imaging device: 10, 11, 46, 47 for executive functions such as: working memory, attention, problem solving, decision making, et cetera.

The fNIRS sensor can access other cortical areas other than the prefrontal, if the subject is bald or shaved. However there are some areas that are difficult to reach. For example the ventral-medial PFC (i.e., the part of the cortex that “folds in” in the middle and the orbito-frontal cortex “folds” behind the eyes, so that they are not accessible). Also the temporal cortex is not totally accessible with our probe because of the ears. Motor cortex and visual cortex are available for measuring, again, in subjects with no hair.
Please see more about fNIRS optode locations in Liu, Y. et al. Measuring speaker–listener neural coupling with functional near infrared spectroscopy. Sci Rep 7, 43293 (2017) and the accompanying Supplementary Information.
Q: Response time?
A: A normal hemodynamic response is within 2 sec-6 sec. With some individuals, not vigilant enough or sleep deprived, it might be 10 sec.
Q: BNC trigger out delay from COBI?
A: The delay from when the recording in COBI starts to when the trigger is sent will not exceed 5 msec. The fNIR Imager sends pulses that are 150 msec wide and the positive rising edge of the pulse should be used for synchronization.
Q: Placement guidelines for sensor based on choice of brain area of interest?
A: The sensor covers most of the forehead (hairless part) for average adults. If the sensor is placed over the hairy part of the side of the head, the signal strength decreases on those side channels (1-2 on the left, 15-16 on the right). For practical purpose, it would provide the best standardized measure if placed as follows:
i. middle of the sensor should point to the nose of the subject
ii. bottom of the sensor should be just above the eyebrows
iii. sides of the sensor should not be over the hairy part of the sides
Q: What are the strengths and limitations of fNIRS?
A – Strengths: Portability, and thus field deployable; safer–uses light emitting diodes, not laser; affordable–cost is much less than others; various validation studies exist for monitoring dorsolateral prefrontal cortex; easy to use – calibration, baseline recording and probe placement takes not more than 10 minutes for an experimenter. 16 channels are well suited for full forehead scan.
A – Limitations: Cannot work on the hairy part of the skull, thus only allows forehead scans; no absolute measurements for the concentration of oxy and deoxy hemoglobin – only relative measures compared to the baseline. However, please keep in mind that most of the cognitive protocol designs are well in line with the device operation as most of the task protocols require ‘resting’ record; not allowing full head scans – note that some cognitive studies require measurements from other brain regions simultaneously; also this is a spectroscopy system not an optical topography system which allows multi-channel screening of various depth of brain so that better 2-D images can be obtained – note that topography systems are not suited for field settings as their size is an issue.
Q: Identify a location or activity?
A: This mostly depends on the cognitive protocol design, which is a true statement for all neuroimaging devices. If the protocol does not elicit any signal in the brain, there is no way to record it. However, various groups including the Drexel Optical Imaging team have implemented many standardized protocols for working memory (i.e., n-back), attention (target categorization, ANT), problem solving (anagram), cognitive workload (air traffic controller task, UAV ground controller task, etc.) and demonstrated that all protocol-induced activities have been identified and the results are in agreement with fMRI and/or EEG studies.
Q: Protocol guidelines?
A: When we design our protocols for various research, we always go through the fMRI protocols and try to be in line with those settings for the response time as we measure the same biomarker. Users should review fMRI literature and use its approach for stimuli number, inter-stimulus time, etc. For example, we have protocols with even 1.5 seconds response duration for attention studies. fMRI studies/references are a good source for protocol designs as many studies have been already published for cognition related research.
Q: Issues from perspiration? Effect when sensor saturated?
A: Sweating affects the optical characteristic, and thus absorption changes become significant due to sweating not hemodynamics. Because subjects do not show such signs during baseline recording, once they start sweating in the middle of the protocol/recording, the readings may change. However, the effects are fairly stable once the face of the sensor is completely saturated and can be eliminated.
A: This interference can be removed in a variety of ways (filtering, PCA, etc.) that have been published by different groups.
Q: Interference from Motion Artifact?
A: fNIRS is definitely more robust than other techniques (such as fMRI), although it is not totally immune. However, studies have demonstrated that the signal can be cleaned to a certain degree; in case your experimental protocol requires subjects to move or walk, we suggest adding an accelerometer to assist in developing basic filters (this procedure for motion artifact correction has been published as well).
In initial studies utilizing subjects running on a treadmill, we were able to clean out the motion effect. However, we used an extra sensor (accelerometer) to record the head movement and removed such effects using the information from it. In sum, the fNIRS can be used for such experiments, but please note that extra steps should be taken such as the use of an accelerometer. Needless to say, it also requires advanced signal processing. Standard filtering and procedures will not work for the artifact removal. One needs to apply adaptive filtering with fine-tuned parameter(s) based on head movement recordings. Otherwise, the results will not be reliable.
Q: Spatial Resolution
A: The sensor can access regions 1-2 cm deep. Location on the prefrontal cortex can be accessed by 16-channel measurements. The spatial resolution is given by the number of source-detector pairs in a region: in this case the forehead probe carries 16 pairs, so the resolution is a couple of cm. However, although fNIRS is a functional imaging technique that gives information about the hemodynamic activity of the cerebral cortex directly underlying a certain source-detector pair, it does not provide any structural information. You could infer, with good approximation, the cortical area that you’re monitoring but, for a more precise localization, a structural MRI is recommended. Similarly, the fNIRS probe is able to monitor activity in the more superficial cortical areas, therefore talking about 3D localization is not appropriate in this case.
2D topographic views can be generated from the measurements, however 3D reconstruction does not make sense for such spectroscopic measures as the system does not provide multi-layer measures. Therefore, 3D topographic views could be problematic. If recordings based on anatomic images (templates) from MRI are used to correlate, then it could be possible to generate 3D reconstructions. Matlab provides tools which allows for rough reconstruction even with some missing pixels (no recording from all the layers of the forehead structure) as this is the case in our system.
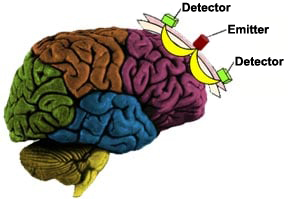
The system employs specified wavelengths (730nm and 850nm) of light within the optical window. Once the photons are introduced into the human head, they are either scattered by extra- and intracellular boundaries of different layers of the head (skin, skull, cerebrospinal fluid, brain, etc.) or absorbed mainly by oxy- and deoxy-Hemoglobin. A photo-detector placed 2.5 cm away from the light source can collect the photons that are not fully absorbed and those that traveled along the “banana shaped path” between the source and detector as shown below.
Those photons interacted with tissue at the tip of the banana shape are the ones that have a high probability of detection by each paired detector. This is a well established principle by physics in optics. Hence, source-signal localization is well defined, and measured light intensity in our system reveals the association with hemodynamic changes within ~1-1.5 cm distance from center of source-detector arrangement.
By measuring optical density (OD) changes at two wavelengths, the relative change of oxy- and deoxy-hemoglobin versus time (this is also a data stream we provide in addition to raw intensity measures) can be obtained and recorded in our system. All these calculations–ODs and concentration changes–are calculated according to the modified Beer-Lambert Law. To eliminate cross-talk as much as possible and provide better localization, these wavelength pairs (730-850nm) are specifically selected and all light sources are activated sequentially. That is, first we turn on the first light source and perform 4 channel measurements at one wavelength then at other wavelength measurements, and then the second light source is turned on, etc. Also all measurements are relative to each baseline recording. In other words, the subjects are supposed to be in a rest condition at the beginning while baseline levels are recorded for each detector. When the cognitive task is initiated, all measurements are relative to each individual detector baseline.
Q: Processing?
A: Raw vs. Processed (utilizing Modified Beer-Lambert Law)
All calculations are done in Cobi–particularly modified Beer-Lambert Law. This is standard for all functional near-infrared spectroscopy devices. There are two display layouts for this purpose. When you start the device, you see raw signals for calibration purposes–checking the signal levels and whether the sensor is placed properly, etc. Then, the program saves the raw signal (for post processing if necessary), as well as all processed data such as oxygenated and deoxygenated hemoglobin data. During on-line recording after calibration and baselining, the user can pick the layout (oxy.clf file) to see the calculated, processed data in real-time. Under the COBI folder, we provide raw.clf (raw data display for all channels during calibration/baselining) and oxy.clf (during real-time functional brain activity task recording) for this purpose. However, the user can modify all those settings in any way they wish. It allows for customization.
Q: Power output? (estimate)
A: The optical power depends on the LED current as well as the wavelength of the light. Each LED module used in the fNIRS system can emit light at three wavelengths (730 nm, 805 nm or 850 nm). A typical power emitted at one wavelength is 12 mW when the LED current is 20 mA. The LED module (TO-5 package, 8 pins) has a glass lens with diameter 6.1 mm. Therefore, the average irradiance is about 41 mW/cm^2 when the LED for one wavelength is driven at 20 mA.
The fNIRS system is operating at 2 Hz (can be increased though). Each cycle is 500 ms. If the fNIRS system is operating with a full-head probe (4 LED modules and 10 detectors), the LEDs for 730 nm and 850 nm (805 nm never activated) for each LED module are turned on for about 33 ms, sequentially. Therefore, in any one cycle of 500 ms, there are eight time slots, 33 ms each, during which one LED at a certain wavelength is turned on. The exposure to the optical power is: 41 mW/cm^2 for 264 ms (33 ms X 8) during a 500 ms period. The averaged exposure is 21.6 mW/cm^2 for a period of 500 ms or any continuous operation time.
A: Using fNIRS on kids would not be different than other neuroimaging modalities, such as EEG. Same issues and problems exist for all when you study kids. However, I do not see any major problem for kids going through multiple paradigms as long as the probe is comfortably placed and stable. Of course, long paradigms need extra attention as subjects become overwhelmed and their attention shifts – this is also the case for adults. Also, the kids are expected to move and it can be difficult to have them stay put. This may cause major motion artifact which needs to be teased out from the fNIRS measures. There is vast literature published on use of NIRS in children. The keywords for the literature search would be ‘near infrared spectroscopy in children’ or NIRS in children, etc. However, we do not have any special lit/paper that mentions specifically our system and child applications. We’ve worked minimally on newborns and only administered one, short protocol.
Q: Will a tumor affect fNIRS signal detection?
A: A frontal cortex tumor may affect oxygenation (capillaries at that region), and if there is no vascularization left in the measurement area, you may not detect any signal or you may see saturation of the photodetectors.
Q: Why won’t fNIRSoft and/or COBI software start?
A: If fNIRSoft and/or COBI software refuse to start, or start only once and then won’t re-open after closing, antivirus software may be silently blocking them. Add the fNIRsoft and COBI directories to the exception list in your antivirus software.
Stay Connected