NIBP100A single pulse data analysis
The NIBP100A has a data output mode that outputs the blood pressure reading to AcqKnowledge only at the actual time of a successful reading. This results in a data record that contains a single beat approximately every 10-15 sec and a straight line in-between. The following description explains how to obtain continuous systolic and diastolic blood pressure channels from this raw blood pressure data.
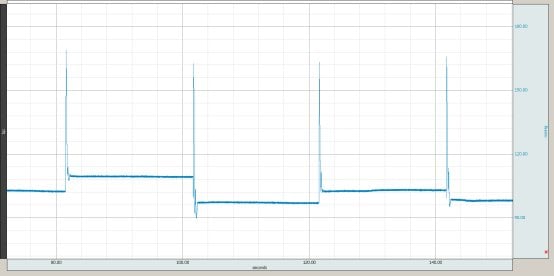
The following image shows blood pressure data collected from an NIBP100A in this mode.
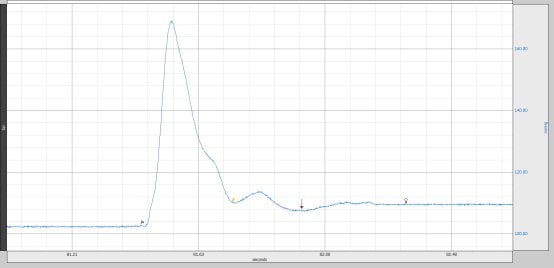
The arrow in the following picture corresponds to the diastolic blood pressure level. Therefore, it is sufficient to take the minimum of the blood pressure waveform 1 sec after the maximum (which is the systolic pressure) in order to obtain the diastolic pressure reading.
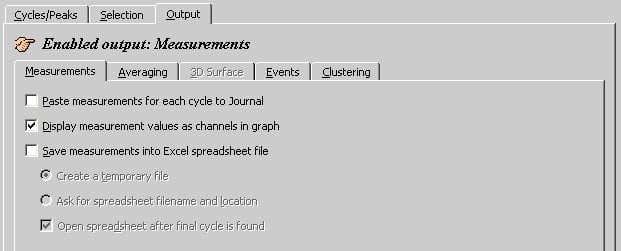
Use the measurement boxes to measure two separate channels for systolic and diastolic pressure. Set the measurement boxes so that they contain only two measurements: Max and Min, both from the blood pressure channel (in this screenshot channel 3 is the blood pressure channel):

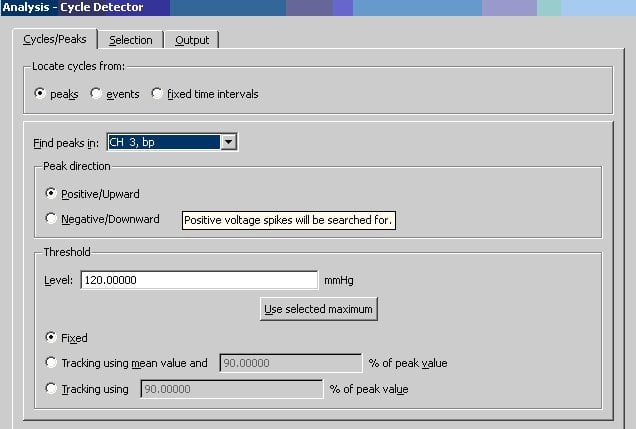
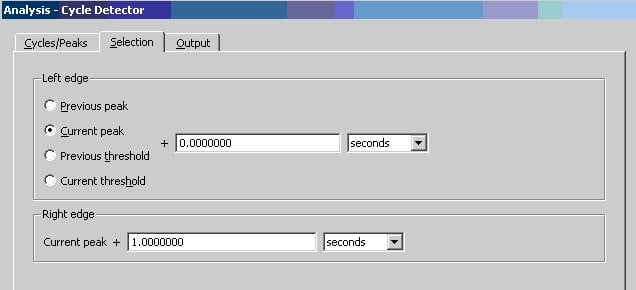
The Find cycle/Peak feature will identify each cusycle and measure the max and min values. Go to Analysis->Find Cycle/Peak and enter the following settings (Set the correct channel number and the threshold. The threshold level should be less than the systolic blood pressure and higher than the diastolic blood pressure) and click Find all cycles.
Two new channels will be output. The max channel gives you systolic blood pressure, the min channel diastolic. (Select the Save measurements to Excel to paste the measurements into Excel. If exporting to Excel, set up a time measurement box to export the time of each measurement).
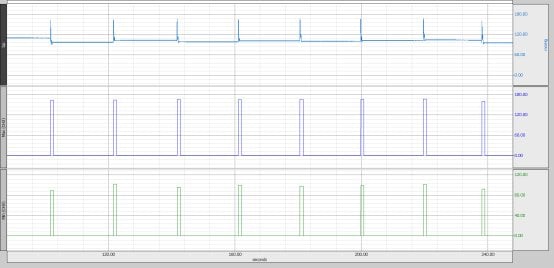
The file should look like this (blood pressure channel on top, max and min below):
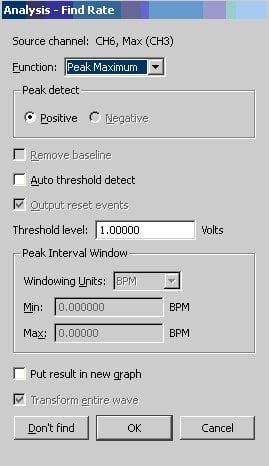
Use Analysis->Find Rate to obtain two continuous waveforms with systolic and diastolic blood pressure.
Select the Max waveform (make sure no data is highlighted) and go to Analysis->Find Rate. Set it up as shown in the screenshot below:
Repeat the last step for the Min waveform.
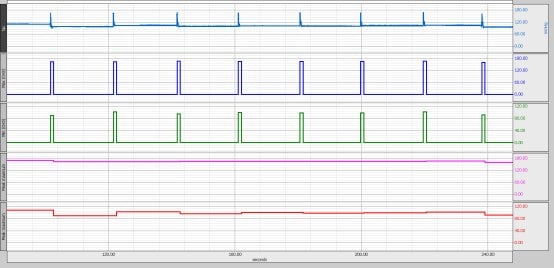
The following screen show shows the new channels…rename them from max/min to systolic and diastolic.
Associated Applications
Associated Application Notes
WHAT'S NEW
With the anticipation of the 2024 Olympics, there has been lots of recent research on athletic...
Stay Connected