Amplifier module filter response times
The MP series amplifier modules incorporate a variety of filtering options. The low pass filtering options have an effect on the signal response time, which is sometimes referred to as signal delay.
Signal delay is often plotted as the function “group delay” versus frequency. This type of plot shows the typical delay the filter will have for a wide range of frequencies. The group delay plot is the derivative of the filter phase plot with respect to frequency. If the filter is perfectly linear phase, the group delay plot will be a straight horizontal line, because the derivative of a constant (linear) slope is a constant.
In practice it’s often difficult to utilize a group delay plot to get a quick and simple handle on essential filter signal delay, unless one is experienced in reading such plots. Instead, it’s typically better to show the filter response to a well-understood input signal, such as a step function.
The following plots illustrate the delay times for a variety of low pass filter settings.
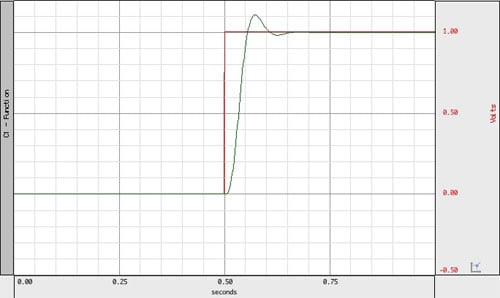
10 Hz Low Pass Filter – 4 pole Besselworth
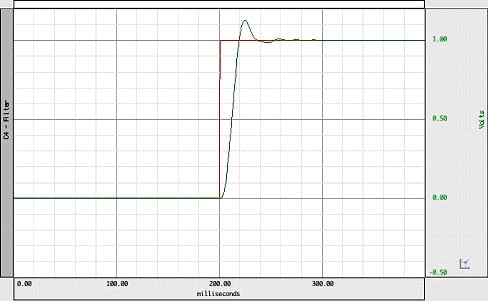
35 Hz Low Pass Notch Filter – 4 pole Besselworth – Notch at 60 Hz
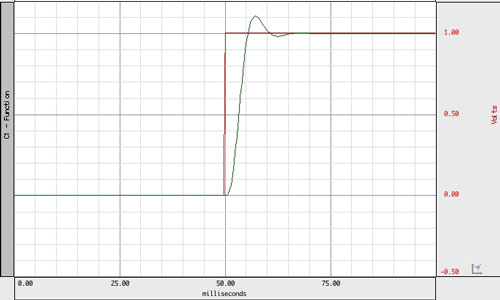
100 Hz Low Pass Filter – 4 pole Besselworth
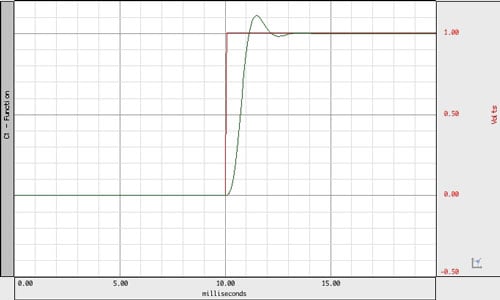
500 Hz Low Pass Filter – 4 pole Besselworth
Note that signal delay is proportional to the cut-off frequency for any particular 4 pole low pass Besselworth filter. The one minor exception is the 35 Hz LPN filter, because it consists of a 4 pole Besselworth filter and a 60 Hz Notch (band reject) filter. This additional filter adds a small additional delay.
Step Response Signal Delay (approximate)
| Filter Type: |
10 Hz LP |
35 Hz LP |
100 Hz LP |
500 Hz LP |
| Delay at 50% (approximate): |
30 ms |
11 ms |
3 ms |
0.6 ms |
Stay Connected