PPG setup and calibration
To record a pulse waveform using the PPG100C, follow these setup and calibration details:
Connections
Plug the transducer into the amplifier but do not connect it to the subject yet.
red lead into VSUP+ portblack lead into GND portblue lead into INPUT port
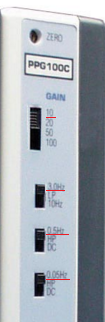 Switch Settings
Hint: Using the 3.0 Hz LP setting and the 0.5 Hz HP setting in conjunction will make it easier to find the rate of the pulse waveform (these filters can be applied in software as well).
Gain: 10 (lowest Gain option) = top position
LP: 3.0 Hz = top positionHP (first bank) : 0.5 Hz HP = top positionHP (second bank): 0.05 Hz HP = top position
Set Up Acquisition
Recommended acquisition sample rate: 100 Hz.
Recording
- Start recording in AcqKnowledge.
- No calibration is necessary—simply make sure the correct channel is enabled and no other amplifiers are set to the same channel.
- Perform Amplifier baseline offset adjustment.
- After the amplifier baseline offset adjustment is complete, place the transducer on the finger (e.g., index finger tip) and tighten the Velcro strap (or attach to the ear with adhesive collars).
- Note: To minimize motion artifact, place the sensor on a hand that will remain mostly immobile.
- Check the tension level.
- If the strap is too tight, blood flow may be constricted, resulting in an almost straight line signal.
- If the strap is too loose, ambient light could enter the sensor, resulting in no recognizable waveform.
- Once you are able to obtain a good recording, it is recommended to increase the gain as much as possible as long as the pulse waveform never goes beyond ±10 Volts.
- The 0.5 Hz HP filter setting will force the signal to return to baseline faster than with the 0.05 Hz filter.
- The 10 Hz LP filter will reveal more detail from the waveform than the 3 Hz LP filter.
- Observe the effect of different filter settings (note that any additional filtering can also be performed in the software, either online or offline).
Sample Results
The following graphs show results of motion artifact and varying tension levels:
Well-placed sensor:
Example of motion artifact (finger):
Example of movement artifact (hand):
Loose sensor:
Tight Sensor:
Associated Applications
Associated Application Notes
WHAT'S NEW
Speech and communication are integral parts of human relationships and development As such,...
Stay Connected