148 – Automated ECG Analysis
ECG Analysis
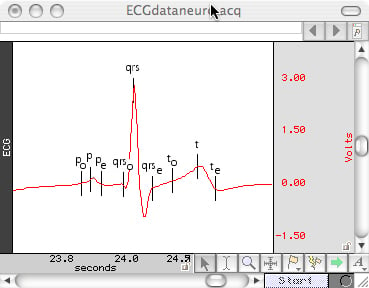
An electrocardiogram (ECG) is a graphical recording of the changes occurring in the electrical potentials between different sites on the skin as a result of cardiac activity. The electrical activity of the heart is a sequence of depolarizations and repolarizations. Depolarization occurs when the cardiac cells, which are electrically polarized, lose their internal negativity. The spread of depolarization travels from cell to cell, producing a wave of depolarization across the entire heart. This wave represents a flow of electricity that can be detected by electrodes placed on the surface of the body. Once depolarization is complete, the cardiac cells are restored to their resting potential, a process called repolarization.
This flow of energy takes on the form of the ECG wave and is characterized by an initial P wave, followed by the QRS complex, and then the T wave. The P wave is associated with depolarization of the atria, the QRS complex is associated with depolarization of the ventricles, and the T wave with repolarization of the ventricles.

Associated Applications
- ICG: Impedance Cardiography/Cardiac Output - Record cardiac output, thoracic impedance changes, or any kind of bioimpedance signal. Use AcqKnowledge for a fully automated ICG analysis and dZ/dt waveform classifier.
- Sleep Studies - Long term recordings with up to 16 channels of data. Record EEG, EOG, EMG, respiration, temp., sound, limb position and more. Filter out EEG frequencies to score sleep stages.
- ECG: Cardiology - Connect up to 16 ECG input leads with MP160 system. Use automated analysis features for HRV, RSA, to classify heartbeats, identify arrhythmias, and perform ECG averaging.
- Cardiovascular Hemodynamics - Hardware for human and animals. Measure continuous BP, ECG, stroke volume, cardiac output, PPG, etc. For animal and tissue look at acute and chronic dose-response.
- In vitro Pharmacology - Record from tissue bath, isolated organ, Ussing chamber, or use field stimulation. Advanced algorithms analyze Langendorff, working heart, and isolated perfused lung data.
- Exercise Physiology - Examine ventilation, oxygen uptake, carbon dioxide production, biopotentials, temp., and biomechanical signals simultaneously. Record wirelessly with BioNomadix.
- Amplifiers & Interfaces - Use BIOPAC amplifiers with MP Systems, as stand-alone devices, or with 3rd-party flow meters, force plates, sono-micrometers, telemetry equipment, metabolic carts, etc.
- Magnetic Resonance Imaging with BIOPAC Equipment - Electrodes, electrode leads, transducers, and stimulus options for safe data acquisition in the MRI. Record biopotentials, temperature, respiration, EDA, dynamometry, blood pressure, etc.
- Stim-Response | Virtual Reality - Synchronize events from a virtual world with physiological data from an MP150 system. Use feedback loops for greater control and automation—change the VR world in real time.
Stay Connected