Guidelines – EDA, EDR, GSR, SCL, and SCR
How can I obtain the mean amplitude of SCRs in a given area of a graph?
The amplitude of a skin conductance response (SCR) is typically defined as the peak height of the tonic skin conductance level minus the value of the tonic skin conductance level at the time that the skin conductance response began. In AcqKnowledge, running “Analysis > Electrodermal Activity > Locate SCRs” causes the software to place “Waveform Onset” event marks at the start of each SCR and “Skin Conductance Response” event marks at the peak of each SCR. These event marks may be used in concert with measurements to determine the average SCR amplitude.
The set of measurements might look like this:
It is generally advisable to include “Time” and “Delta T” measurements as these will be helpful any time the raw data are to be checked against extracted statistics.
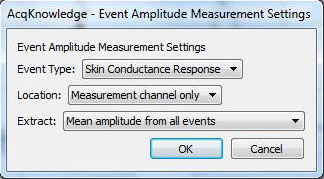
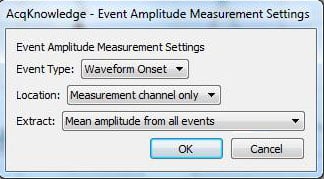
The two “Evt_ampl…” measurements determine the mean of the peaks of the SCRs and the means of the SCR onsets:
The “Calculate…” measurement subtracts the mean waveform onset from the mean peak:
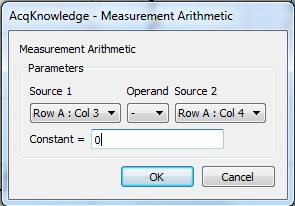
Note that in the measurements, “amplitude” refers to the value of the data at the point of the event mark—the term is not used in the same way it is normally used for skin conductance response. For the “Calculate…” measurement, there is only one row of measurements and hence all are in “Row A.” Column 3 is the first “Evt_ampl…” measurement (Event type “Skin Conductance Response”) and Column 4 is the second (Event type “Waveform Onset”).
Because a single skin conductance response amplitude is defined as the SCL at the peak minus the SCL at the start, the mean of all skin conductance responses can be computed as:
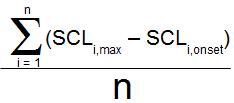 where there are n skin conductance responses, and SCLi,max is the peak skin conductance value of the ith SCR, and SCLi,onset is the skin conductance value at the beginning of that same SCR.
The summation performed for this average may be broken down into two summation terms:
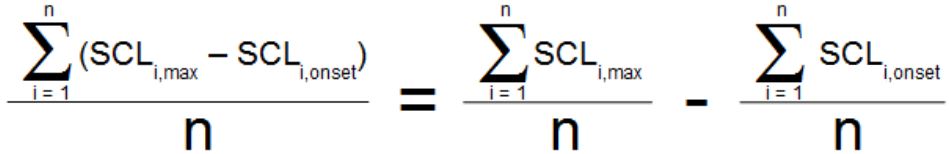
The two terms on the right side of this equation are the numbers computed by the third and fourth measurements in the row of measurements above, so the final measurement, the “Calculate…” measurement, represents the term on the left side of the equation—the average SCR amplitude.
With “Find Cycle” used to select areas (e.g., between event marks indicating different phases of an experiment or over fixed time intervals to see how average SCR amplitudes varied within a single phase of an experiment), the above measurements may be used to extract statistics to a spreadsheet.
See also
Tutorial Video | EDA – SCR Event Related Analysis
WHAT'S NEW
Speech and communication are integral parts of human relationships and development As such,...
Stay Connected