EEG Spectral Analysis
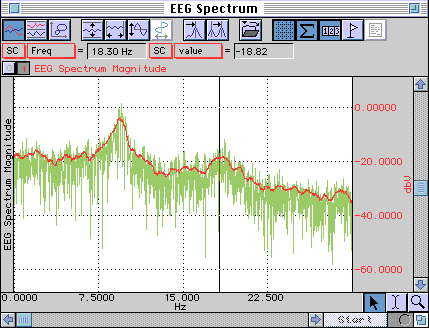
AcqKnowledge can be used to obtain the power spectrum of the EEG, with frequency representation in linear or logarithmic scaling. The power spectrum, which can be used to analyze a variety of physiological signals, indicates the power of frequency components in the source time domain waveform and is defined as the square of the linear spectrum magnitude
See More...Details
.
Support
Application Notes
- 127 - Precision Force Transducers
- 101 - Transducer Calibration and Signal Re-Scaling
- 114b - Pneumotach Transducer - TSD107B
- 130 - Noninvasive Blood Pressure Measurement - TSD120
- 132 - Variable Force Transducer- TSD105A
- 135 - Pneumotach Transducer - TSD117
- 140 - Goniometers: Angular Measurements
- 141 - Tri-axial Accelerometer Calibration - TSD109 series or SS26/27
- 145 - Respiratory Effort Transducer - TSD101B
- 154 - High Level Transducer Connections - HLT100C
- 159 - Hand Switch and Foot Switch - TSD116 Series
- 186 - Variable Assessment Transducer - TSD115
- 224 - Noninvasive Blood Pressure System Calibration - NIBP100A
- 103 - Remote Monitoring System - TEL100
- 109 - 3-, 6-, and 12-Lead ECG
- 110 - Amplifier Baseline Offset Adjustment
- 126 - Wireless Remote Monitoring - TEL100C-RF
- 136 - Battery Pack Instructions - BAT100
- 149 - O2100C Module Setup for the MP System
- 151 - CO2100C Module Setup for the MP System
- 160 - Gas Analysis Module Response Time
- 162 - Stimulation Features of MP160/150/100 Systems
- 170 - Laser Doppler Flow Module - LDF100C
- 175 - Stimulus Isolator Guidelines - STMISOC
- 184 - Interfacing Millar Mikro-Tip Catheters With MP Research Systems
- 185 - iMac and G3 Compatibility Issues
- 187 - Electrodermal Response Guidelines - EDA100C (GSR100C)
- 190 - Micro-Electrode Amplifier Guidelines - MCE100C
- 195 - MP System Data Sampling Reference
- 196 - Cardiac Output Measurement - EBI100C
- 206 - Continuous 12-Lead ECG
- 207 - UDP Install: MP150 + No Network Access
- 208 - UDP Install: MP150 + Domain Network Access
- 209 - UDP Install: MP150 + Network Access or Multiple Computers
- 215 - Noninvasive Cardiac Ouput - NICO100C
- 223 - Physiological Measurement in Magnetic Resonance Imaging Systems
- 105 - Auditory Brainstem Response (ABR) Testing
- 111 - Nerve Conduction Velocity
- 115 - Hemodynamic Measurements
- 118 - EMG Frequency Signal Analysis
- 120 - X/Y Loop Area Analysis
- 121 - Waveform Data Reduction
- 122 - Power Spectrum Analysis
- 129 - Heart Rate Variability
- 131 - Averaging Mode in the MP System
- 142 - Rate Detector Algorithm in AcqKnowledge
- 143 - Importing AcqKnowledge Data Into Excel
- 148 - Automated ECG Analysis
- 150 - O2100C Module for Oxygen Consumption
- 152 - CO2100C Module Application Example
- 155 - AcqKnowledge File Formats for the Macintosh
- 156 - AcqKnowledge File Formats for PC With Windows
- 158 - Analyzing Inspired & Expired Lung Volume
- 161 - Automated Tissue Bath Analysis
- 168 - Analyzing Intraventricular Pressure Wave Data (LVP Analysis)
- 169 - Speech Motor Control
- 171 - New Features of AcqKnowledge v3.5 for Windows 95, 98, and NT
- 177 - ECG Analysis Using the Offline Averaging Mode
- 182 - Analysis of Blood Flow Data
- 183 - VO2 and RER Measurement
- 191 - Digital I/O Channels
- 197 - New Features of AcqKnowledge v3.5 for Macintosh USB
- 198 - Prepulse Inhibition of Startle
- 199 - Impedance Cardiography and Pre-ejection Period
- 200 - Creating Arbitrary Waveforms for the MP Systems Stimulator
- 201 - SuperLab With AcqKnowledge
- 204 - AcqKnowledge Peak Detector Operation
- 211 - EEG Analysis With AcqKnowledge
- 210 - New Features for AcqKnowledge v3.7 for Mac
- 214 - EMG Startle Scoring for Prepulse Inhibition Studies
- 216 - Electrodermal Activity (EDA/GSR) Scoring Methods
- 218 - Hardware API
- 219 - Known Issues - AcqKnowledge
- 221 - Simplified VO2 Measurement (Without CO2 Values)
- 226 - BIOPAC Software Compatibility on Mac-Intel Core Duo Machines
- 115 - Hemodynamic Measurements with BSL PRO
- 116 - Hemodynamic Measurements - Part 2
- 117 - Pulse Transit Time and Velocity Calculation
- 118 - EMG Signal Analysis
- 148 - Automated ECG Analysis - BSL
- 158 - Analyzing Inspired & Expired Lung Volume - BSL
- 161 - Automated Tissue Bath Analysis - BSL
- 165 - Integrated EMG
- 166 - Upgrading From BSL PRO 2.xx to BSL PRO 3.0
- 167 - Upgrading From Biopac Student Lab 2.xx to 3.0
- 168 - Analyzing Intraventricular Pressure Wave Data (LVP Analysis) - BSL
- 180 - BSL PRO v3.6 Software Changes
- 181 - Producing an Integrated Airflow Signal
- 217 - Importing BSL PRO Data Into Excel (or other spreadsheet programs)
- 130 - Blood Pressure Measurement for the BSL PRO
- 132 - Variable Force Transducer - SS12LA
- 135 - Airflow Transducer Calibration - SS11LA
- 140 - Goniometers: Angular Measurements
- 141 - Tri-Axial Accelerometer Calibration - BSL
- 144 - Hand Dynamometer Calibration - BSL
- 172 - Multilead ECG Cable - SS29L
- 173 - Electronic Stethoscope Transducer - SS30L
- 179 - Interfacing Narco Myographs to Biopac Student Lab
- 222 - Pseudorandom Stimuli Following Stimulus Presentation
- 102 - Biopotential Amplifier Testing With CBLCAL
- 117 - Pulse Transit Time and Velocity Calculation
- 227 - Biopac Student Lab Publications
- 300 - Line In Audio Adapter Compatibility
- 230 - Connections for Physiological Signals in an MRI
- 231 - NIBP100B-R Calibration
- 232 - EMG: Normalize to Maximum Voluntary Contraction
- 232 - EMG: Normalize to Maximum Voluntary Contraction - BSL PRO
- 233 - Heart Rate Variability - Preparing Data for Analysis
- 234 - Virtual Reality / Immersive Environment
- 235 - Zygomaticus Measures with Pressure Pad vs. EMG in MRI or fMRI
- 004 - MP150 Firmware Compatibility
- 001 - AcqKnowledge Release and OS Compatibility
- 002 - BSL Release and OS Compatibility
- 003 - BScL Release and OS Compatibility
- 231 - NIBP100B-E Calibration
- 238 - Software options for controlling the SDS100 Scent Delivery System
- 239 - Send to AcqKnowledge from Vizard via parallel port
- 240 - Measurement Computing card setup
- 241 - Recording EMG data in an fMRI
- 242 - Recording ECG Data in an fMRI
- 243 - Gated Analysis for Data Recorded in an MRI - EMG example
- 245 - DTU200 Dual Channel Gating Setup and Operating Instructions
- 246 - R-R Interval Processing with the BIOPAC HRV Algorithm
- 249 - Online Averaging Latency Parameters
- 250 - Assess Muscle Effort with Vibromyography
- 251 - n-back for fNIR with AcqKnowledge
- 252 - Aerobic Capacity, Physical Fitness and VO2 Max
- 253 - BBS | Getting Started with BIOPAC Basic Scripting
- 255 - Artifact Rejection: Verification Procedure (MP150 System)
- 256 - BBS | Video Scoring with BIOPAC Basic Scripting
- 257 - Safe Use of Electrical Stimulators
- 258 - BIOPAC MRI Smart Amplifier Performance
- 259 - ECG Averaging in the MRI using the ECG100C-MRI amplifier
- 260 - Using Vibromyography to obtain length-tension curves for the quadriceps muscles
- 261 - TSD250 (BPS-II) VMG transducer in the assessment of isometric absolute muscle effort
- 262 - VMG to assess quad-hamstring activity after ACL tear
- 263 - Strategies to Record Biopotential or Transducer Data in MRI or fMRI
- 264 - BBS | Scripting: Flow Control via Graph File UI
- 265 - MRI Artifact Removal from ECG Waveforms
- 266 - Tri-axial Accelerometer Measurements using BioNomadix
- 267 - Wireless Noninvasive Cardiovascular Reactivity Measurement
- 268 - Metabolic Analysis Systems and Propane-based Verification
- 270 - Synchronizing Physiology Data Recording with Associated Video
- 271 - Synchronizing B-Alert and MP150 on separate computers
- 273 - Use BioNomadix Accelerometer as Tilt Sensor or Inclinometer
- 275 - Dynamometers for Low Hand Grip Strength Measurements
- 276 - Emotional State (Affect) Recognition via Physiological Measures & Processing
- 277 - Transcranial Current Stimulation Using STMISOLA
- 278 - Percent End Tidal CO2 Measurement using C02100C
- 279 - ECG and EDA Recording in 7-Tesla fMRI
- 280 - ETHUSB Communication - Mac OS X 10.7 or above
- 281 - ECG Timing Delay Associated with Amplifier Filter Selections
- 282 - Subject Electrical Stimulation in fMRI and MRI
- 283 - fMRI Imaging Sequencing Effects upon Physiological Measurement
- 284 - fNIR Systems – Dark Current Measurements
- 285 - Identifying Stimulation Threshold
- 286 - NIBP100D Calibration
- 287 - MP3x Drivers in Mac OS 10.13
- 288 - How to Turn Events into Graph Channels
- 290 - BBS Feedback Control
- 291 - BBS Pulse Amplitude Feedback
- 292 - Interfacing with E-Prime®
- 293 - Displaying BPM Through Seven Segment Displays
- 294 - Trans-radial Electrical Bioimpedance Velocimetry (TREV and TRUEV)
- 296 - Continuous Monitoring of a Monotonic Signal for GASSYS3
- 244 - Programmable Stimulator for E-Prime®
Knowledge Base
- Arbitrary waveform stimulation
- Grounding guidelines
- Gel for EDA (GSR)/SCR
- Recording good data
- AcqKnowledge backwards compatibility
- Extracting data segments from a file
- Text files - import and export
- Electrodermal activity measurements
- MRI - Triggering
- Volume from airflow
- Interfacing third-party amplifiers
- Railing signal (flatline)
- NIBP100A sensor height & signal output
- Buffer overflow
- Extracting heart rate from a noisy ECG signal
- AC mode
- DC mode
- Low pass filters
- High pass filters
- Band-pass and band-stop filters
- Notch filter
- Amplifier filter settings
- Calibration values
- Common mistakes/general troubleshooting
- Deep breath and SCR/EDA increase
- Reusable vs. disposable EDA/GSR electrodes
- IIR vs. FIR filters
- Deep breath and PPG signal flattening
- EEG reference - linked ears, summed ears, etc.
- Maximum number of channels for EEG
- Ground vs. reference for EEG recording
- Bipolar EEG
- VREF, reference excitation voltage
- Editing noisy data
- * CLEANING GUIDELINES *
- Calculating file sizes
- Using other software with BIOPAC hardware
- AcqKnowledge accuracy
- Interfacing third-party transducers
- Amplifier analog output signals
- ECG R-wave detector
- ECG Analysis
- Interface with visual presentation programs
- Upgrading from PCMCIA to USB
- Combining Video with AcqKnowledge
- LabView interface
- USB Drivers and Controller Communication
- EEG frequency bands
- NIBP100A and pulse plethysmography
- Outputting a signal through the STM100C
- Visual presentation system triggering the MP150/100
- MP150 UDP protocol fixed IP address
- Biopac Science Lab - System Check Troubleshooting
- Electrode Check on older MP36 and MP35
- Duplicating waveforms
- Electrical stimulation and artifact
- MP System Comparison: MP150 vs. MP100
- Amplifier conversion - 2 mm to touchproof
- Amplifier baseline offset adjustment
- Biopotential amplifier signal validation
- DA100C amplifier signal validation
- Electrode Properties - gel and adhesive
- Biopac Science Lab Line In Ports
- EDA (GSR) subject preparation
- Disc I/O error 5000
- Guidelines - EDA, EDR, GSR, SCL, and SCR
- AFT11 Series coupler guide
- Clinical chart grid setting for ECG
- CAP100C electrode connections
- PPG setup and calibration
- National Science Education Standards Correlation
- GLP Lab Assistant - Good Laboratory Practice
- MP150 Firmware Compatibility
- ECG artifact in EMG Signal
- Differences between the NICO100C and EBI100C
- MRI, Radiotranslucent, and Radio-opaque Compatibility
- Section 508 Compliance
- BSL PRO optimize range
- Compatibility: OS & Computer Requirements
- Magnetic stimulation artifacts
- Optimal ground placement
- Respiration recording
- Negative EDA (GSR)
- Loading Physiobank data files
- Audio recording synchronization
- SuperLab troubleshooting
- Screenshots in BIOPAC software
- QRS Amplitiude & Respiratory Modulation
- Inverted Waveform
- Calibration in Volts, Millivolts, Microvolts
- FIR Filter - AcqKnowledge 3.9.2 (Mac)
- MP40 sample rates
- Nerve Chamber to MP1XX System
- Gould interface
- FIR issue - AcqKnowledge 3.9.x for Mac
- EOG vs. EMG amplifier
- MP3X Filters
- External Devices and Channel Contention
- Multiple amplifiers per subject or multiple subjects per system
- NIBP100C Calibration Values
- NIBP100A single pulse data analysis
- EDA / SCR offset calibration for MRI
- Connecting the TSD116C Switch Box
- Copy and paste append markers along with data
- Lab or Room Electrical Considerations for an MP system
- AcqKnowledge 4 and Windows XP
- Artifact Rejection verification procedure
- fNIR FAQ
- Discontinued Items
- EMG - underwater measures
- BIOPAC Basic Scripting - available scripts
- Calculation Channel Scaling (i.e. Expression Evaluator)
- Tutorial Electrostatic Discharge
- Exporting Data to SPSS
- Amplifier module filter response times
- Glossary of specification terminology
- BioHarness data logging with Windows 8
- AcqKnowledge: Newest Features
- AcqKnowledge License Key Registration and Replacement Options
- Routing TTL pulses out of the STP100C BNC connector
- AcqKnowledge iLok USB Key Issues
- Exporting Event Labels into MATLAB
- Guidelines for Psychophysiological Recordings
- Galvanic Isolation Guidelines for MP Research Systems
- ETHUSB Ethernet not communicating on Mac OS X 10.7 or above
- Resting Heart Rates
- BioHarness pairing with BT
- Physiological measurements - life science signals using BIOPAC
- Missing Lessons in Startup Wizard | Biopac Student Lab
- Unable to establish communication with any data acquisition hardware
- How do I set up my equipment?
- How come the "start" button in my software is grayed out and unusable?
- Where do I place electrodes/sensors/transducers?
- How should I prepare electrode sites?
- What types of electrode should I use?
- How do I sync my stimulus presentation software with my data acquisition software?
- How do I calibrate my data hardware?
- How come when I try to record data all I see is a flat line?
- Can I get the MSDS for electrode gels?
- How do I calibrate my data software?
- How can I determine which software versions are compatible with which operating systems?
- Installation CD/DVD lost or damaged...how can I re-install software?
- Single user license
- Invisible channel changes
- No cycles found
- Data export to spreadsheet
- Exchanging files
- Computing heart rate
- Unexpected HRV results
- HRV meaning
- Stroke volume
- Volume calculation
- Flash player installation
- Signal inversion
- Unipolar-EEG
- Phasic EDA: Methods for computing phasic skin conductance from tonic
- Electrode tape for cardiac output measurements
- BioNomadix Signal Interruption
- Measuring respiration from impedance (ICG) data
- MRI Data Cleaning | PhysIO Toolbox to Remove Image Artifact
- - Top 10 Knowledge Base Queries
- Height/Weight entries for CO using Kubicek/Rho method
- B-Alert Gauges Unresponsive
- B-Alert “Use B-Alert Definition File” generates error
- AcqKnowledge iLok key lost or unavailable
- How can I obtain the mean amplitude of SCRs in a given area of a graph?
- Excel files exported from BIOPAC software open in Excel 'Protected View'
- BioNomadix Transmitter Battery Level
- Connecting Calibration Gas Tanks & Mixing Chambers
- Troubleshooting MP160 Ethernet Communication
- How can I move QRS peak event marks from the bottom of S waves to the top of R waves?
- Enabling the Transform Menu in BSL Analysis (RSD)
- Event Markers | Correcting Automated Placement
- MRI Recording Physiology Data | Recommended Readings
- How to cut a TSD147A and TSD147AL single fiber
- About License Keys
- Bioimpedance Methods
- HMD Plus Sensors for fNIRS and/or B-Alert
- Biopac Student Lab (BSL) Newest Features
- Checking Finger Cuff Lifetime for NIBP100D/NIBP100D-HD
Hardware Packages | EEG Spectral Analysis
Hardware Bundles are complete solutions for the specified application. Choose your preferred platform and bundle, then click "Request Pricing" to request an estimate, add/remove items, or complete purchase. If you have questions about specific items, click through to the product web page for details and specifications, or contact your Local Sales contact.
Wired
-
MP36R System plus leads and 8 mm reusable electrodes
Wired | EEG Spectral Analysis
MP36R with AcqKnowledge plus shielded lead set, 8 mm reusable snap electrodes and electrode gel
-
MP160 System + twelve EEG amps and electrode cap
Wired | EEG Spectral Analysis
MP160 System with AcqKnowledge plus twelve EEG amps and an electrode cap
MP36R System plus leads and 8 mm reusable electrodes
- 1 x MP36R Systems
- 12 x Ag-AgCl Reusable Snap Electrodes
- 1 x Adhesive Disks
- 1 x Electrode Gels
- 4 x Lead set, shielded, BSL
- 1 x Abrasive Pads 10/pk
MP160 System + twelve EEG amps and electrode cap
- 1 x MP160 Data Acquisition Systems
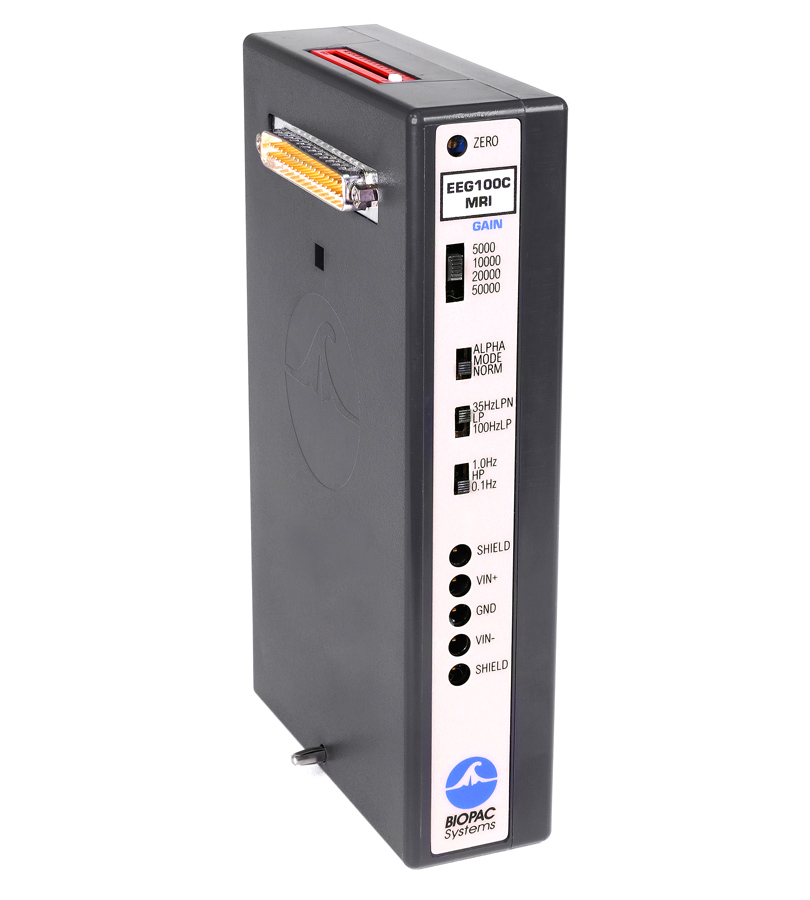
- 12 x EEG Electroencephalogram Amplifier
- 1 x Electrode Cap Sys., TouchProof
- 1 x Electrode Impedance Checker
Wireless
-
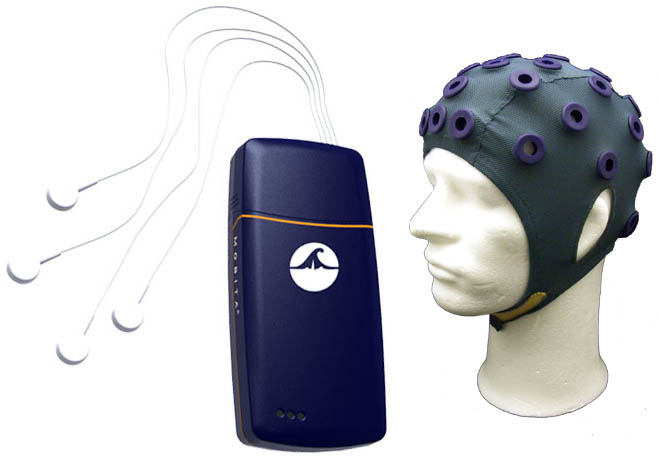
MP160 System + wireless EEG amps & EEG cap system
Wireless | EEG Spectral Analysis
MP160 System with AcqKnowledge plus six BioNomadix wireless EEG amps, BioNomadix EEG cap system, and impedance checker
-
BioNomadix Logger with EEG Cap System
Wireless | EEG Spectral Analysis
BioNomadix Logger and three transmitters for wireless EEG, EEG cap system, Touch proof electrode adapters & Impedance Checker
-
MP160 System + wireless mouse EEG telemetry system
Wireless | EEG Spectral Analysis
MP160 System with wireless mouse EEG telemetry system
-
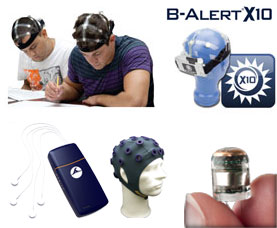
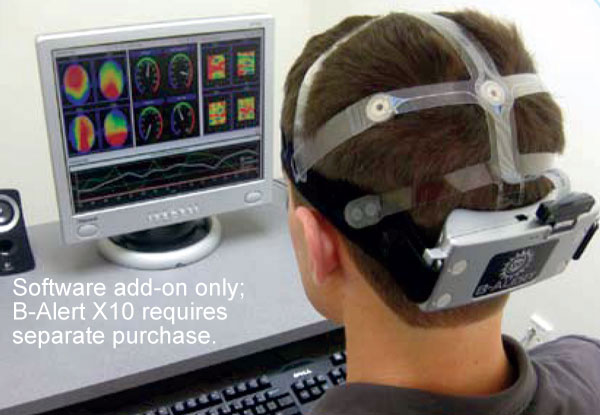
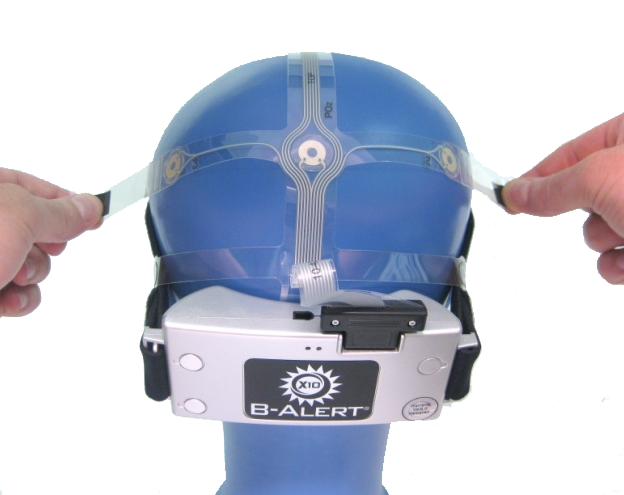
B-Alert X10 (9 channels EEG + 1 ECG) and AcqKnowledge
Wireless | EEG Spectral Analysis
X10 Wireless EEG (9 EEG channels + 1 ECG channel) with current release AcqKnowledge software
MP160 System + wireless EEG amps & EEG cap system
- 1 x MP160 Data Acquisition Systems
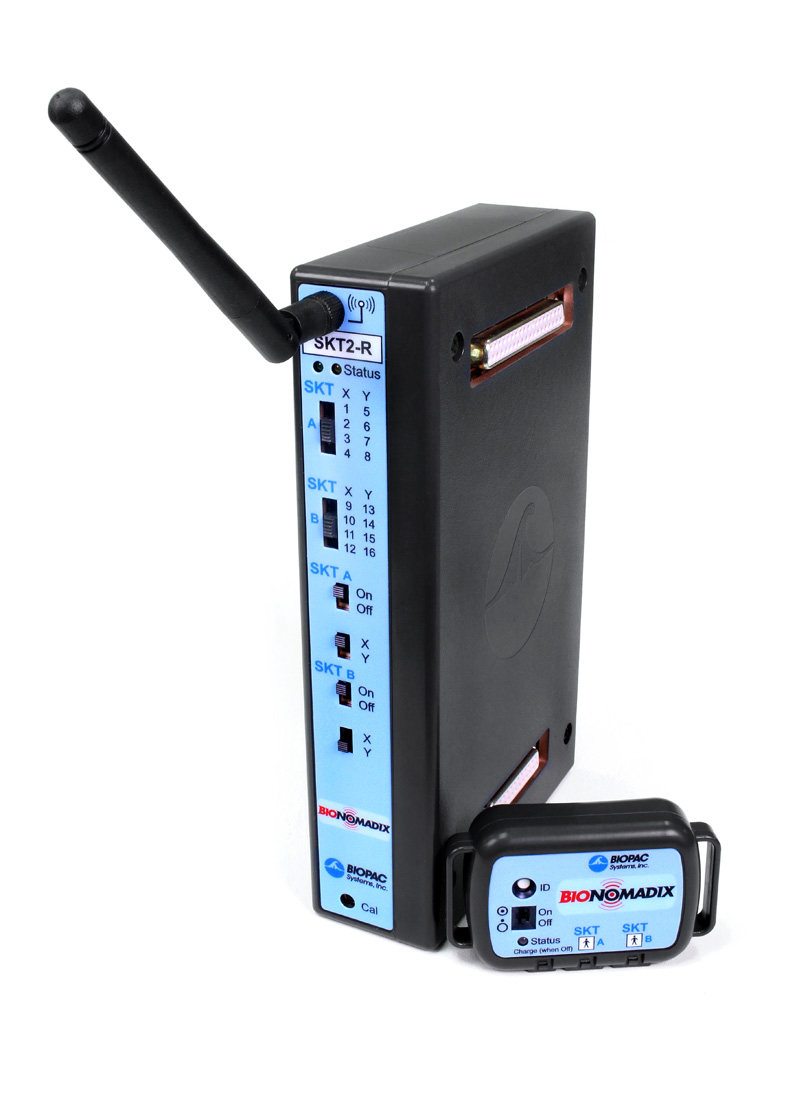
- 6 x BioNomadix 2Ch Wireless EEG Amplifier
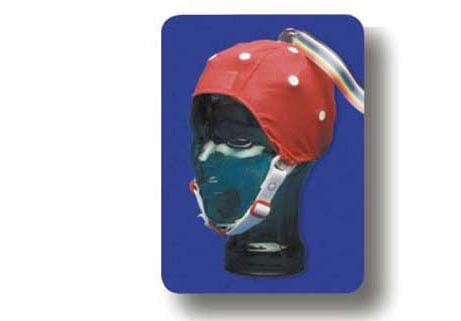
- 1 x BioNomadix Wireless EEG 10/20 Cap System
- 1 x BioNomadix Touchproof Adapters
- 1 x BioNomadix Touchproof Adapters
- 1 x Abrasive Pads 10/pk
- 1 x Electrode Impedance Checker
BioNomadix Logger with EEG Cap System
- 1 x BioNomadix Wireless Wearable Physiology Logger
- 1 x BioNomadix Touchproof Adapters
- 1 x BioNomadix Touchproof Adapters
- 1 x BioNomadix Wireless EEG 10/20 Cap System
- 1 x Abrasive Pads 10/pk
- 1 x Electrode Impedance Checker
MP160 System + wireless mouse EEG telemetry system
- 1 x MP160 Data Acquisition Systems
- 1 x EPOCH Wireless EEG Systems for Animals
B-Alert X10 (9 channels EEG + 1 ECG) and AcqKnowledge
- 1 x Unknown Product (Array)
Animal
-
MP36R System plus 2-ch wireless EEG system for mice
Animal | EEG Spectral Analysis
MP36R with AcqKnowledge plus 2 channel wireless EEG system for mice
-
MP160 System + wireless mouse EEG telemetry system
Animal | EEG Spectral Analysis
MP160 System with wireless mouse EEG telemetry system
MP36R System plus 2-ch wireless EEG system for mice
- 1 x MP36R Systems
- 1 x EPOCH Wireless EEG Systems for Animals
- 2 x Input Adapters - BNC
MP160 System + wireless mouse EEG telemetry system
- 1 x MP160 Data Acquisition Systems
- 1 x EPOCH Wireless EEG Systems for Animals
Stay Connected