
Slope method
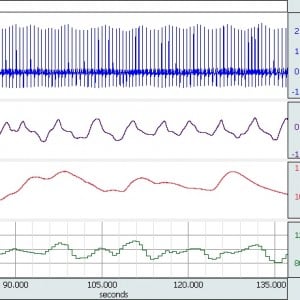
This method operates over user selected regions of data or the entire file. The routine identifies each ECG cycle and marks the components within the cycle (P,Q,R,S & T) and also locates and marks the systolic and diastolic points of the blood pressure signal. Systolic blood pressure values are plotted against the heart rate values in an interactive X/Y display that includes a table of values for each cycle. When a particular point is selected in the X/Y plot, the display highlights the data in the time series chart display. Data points can be turned off and on by selecting the X/Y points, or identifying them in the data table, and the slope of the best linear regression fit is updated to reflect the changes. The BRS value and goodness of fit value are also displayed and updated as data points are turned on and off.
Sequence method
This method operates over the entire file or within focus areas. The routine identifies each ECG cycle and marks the components within the cycle (P, Q, R, S & T) and also locates and marks the systolic and diastolic points of the blood pressure signal. There is an option for displaying the R-R values and systolic blood pressure values as new channels so that you can quickly identify outliers or noise in the raw data. The primary dialog includes settings for the minimum number of consecutive increasing or decreasing cycles and the minimum rate of change for heart rate (msec) and systolic blood pressure (mmHg) before a sequence is initiated. The results of the analysis are displayed in the Journal or spreadsheet file.

References
- Kuusela, Tom. On the Analysis of Baroreflex Sensitivity. 2010.
- Patakas, D., Louridas, G. et. al. Reduced baroreceptor sensitivity in patients with chronic obstructive pulmonary disease. Thorax 1982; 37:292-295.
- Reyes del Paso, Gustavo A. A program to assess baroreceptor cardiac reflex function. Behaviour Research Methods, Instruments & Computers. 1994, 26 (1), 62-64.
Product Family
Product Type
Product Options
- AcqKnowledge for Stellar Telemetry
- AcqKnowledge License Pack: Scripting, NDT, BHAPI, ACKAPI
- AcqKnowledge Site Licenses
- AcqKnowledge Software
- AcqKnowledge Software Upgrade to current release
- Remote Monitor License for AcqKnowledge
- Basic Scripting Licenses
- P/V Loop Licenses
- Actigraphy Licenses
- Stellar Implant Licenses
AUTOMATED ECG ANALYSIS
Fully automated ECG scoring and analysis with direct export to spreadsheet
Monitor, record and analyze changes in baroreflex sensitivity
Slope method operates over user selected regions of data or the entire file. Sequence method operates over the entire file or within focus areas.
Connect to MP160 Systems
The MP Research System plus BIOPAC amplifiers acts as a complete, fully-isolated life science data acquisition system
Stay Connected