
QuickStart Template
Quickly start recording with the included QuickStart Template. The template has the analog and calculation channels pre-programmed and a custom display the shows both the raw waveform data and the most recent loop data at the same time. The template also includes a cardiac values toolbar with key cardiac measures updated every second!

During recording, see the most recent loop data and cardiac values
updated every second!
The Loop Display Window can show:
- Pressure vs. Volume
- Pressure vs. Magnitude
- Pressure vs. Phase
Easily toggle between the three views with toolbar buttons. The number of seconds of loop data displayed can also be customized, default is most recent 6 seconds.
Baseline Analysis
Baseline Analysis extracts basic single loop measures over user selected data range. The analysis will locate the pressure, volume, and derivative signals and will find the End Diastolic (ED) and End Systolic (ES) boundaries for each loop. The following measures are then extracted for each loop:
The Baseline Analysis can be used to confirm catheter positioning and to view preliminary results to experimental conditions. Results are output in a text table similar to the shown below and can be exported to Excel or saved as a text file.
- Tstart- loop start time
- Pmax – max pressure
- Vmax – max volume
- HR- heart rate
- Pmin – min pressure
- Vmin – min volume
- ESP – end systolic pressure
- dP max – max dP/dt
- ESV – end systolic volume
- EDP – end diastolic pressure
- dPmin – min dP/dt
- EDV – end diastolic volume
- SV – stroke volume
- CO – cardiac output
Full Pressure-Volume Loop Analysis
The full PV Loop Analysis will examine PV loops in a user selected area of the graph. End Diastolic and End Systolic event markers will be placed on all loops in the selected area.
The main analysis window is comprised of three sections.

The upper half of the analysis window is split in two with left side showing the multiple loop measures, and right side showing the loop display.
Loop Display: X/Y plot of Pressure vs. Volume.
-
- Each loop is drawn using waveform plot color.
- End Diastolic and End Systolic indicators are plotted as black squares on each loop.
- The user can easily select which loops are included/excluded from analysis by clicking on their loop checkbox to the left of the display.
- Loops not included in analysis will be drawn with a dotted line instead of a solid line and their measures in the bottom table will be grayed out.
- ESPVR and EDPVR best fit curves are also overlaid on the loop display.
Multiple Loop Measures Include:
-
- ESPVR (end systolic pressure volume relationship): theoretical max pressure for any given volume
- EDPVR (end diastolic pressure volume relationship): passive filling properties of ventricle, reciprocal of ventricular stiffness
- PRSW (Preload recruitable stroke work): linear regression between stroke work and end diastolic volume between loops
- dPmax vs. EDV
- PVA vs. EDV
- PVA vs. ESV

The lower half displays a text table with per-loop derived measures. Each loop in the selected area will have its own row and the columns displayed will be the same measures displayed in baseline analysis (see above, and can be changed in preferences) and additional power and Tau measures. Measurements can be saved as text, or exported to Excel.
Product Family
Product Type
Product Options
- AcqKnowledge for Stellar Telemetry
- AcqKnowledge License Pack: Scripting, NDT, BHAPI, ACKAPI
- AcqKnowledge Site Licenses
- AcqKnowledge Software
- AcqKnowledge Software Upgrade to current release
- Remote Monitor License for AcqKnowledge
- Baroreflex Sensitivity Licenses
- Basic Scripting Licenses
- Network Data Transfer Licenses
- Actigraphy Licenses
- Stellar Implant Licenses
Volume/Flow Loop Relationships
Easily compare normal tidal breathing loops to maximum breathing loops by using the X/Y mode to plot flow versus volume.
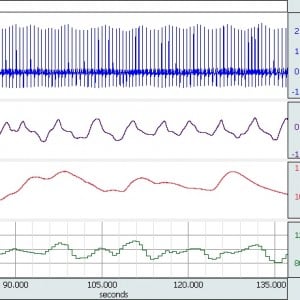
Real-Time Data, Automated Analysis
View raw waveform data & the most recent loop data in real-time. Run automated analysis routines.
Connect to MP160 Systems
The MP Research System plus BIOPAC amplifiers acts as a complete, fully-isolated life science data acquisition system
Stay Connected