Record high-fidelity blood pressure (LVP, arterial, or noninvasive) with industry leading hardware for humans or small animals. MRI options are also available for both human and animal blood pressure recording. AcqKnowledge software includes the following automated Arterial Blood Pressure Analysis routines, along with dozens of other automated analysis routines and transformation tools:
- ABP Classifier
Click Videos tab to watch ABP Classifier and Analysis in action.
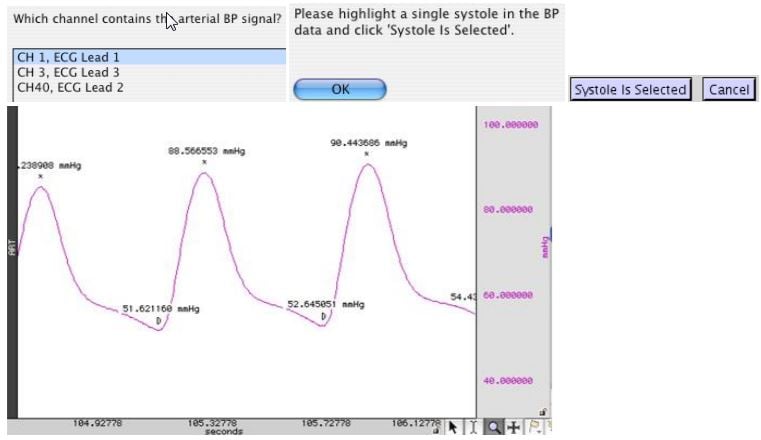
- Arterial Blood Pressure Analysis

- Left Ventricular Blood Pressure Analysis
Click Videos tab to see LVP Classifier and Analysis in action.
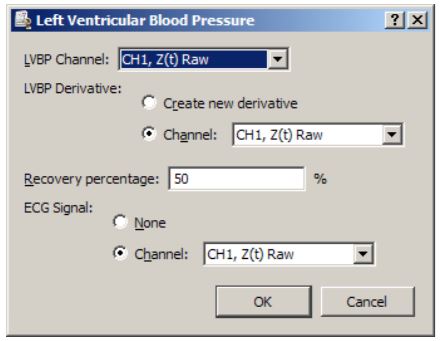
- LVP Classifier
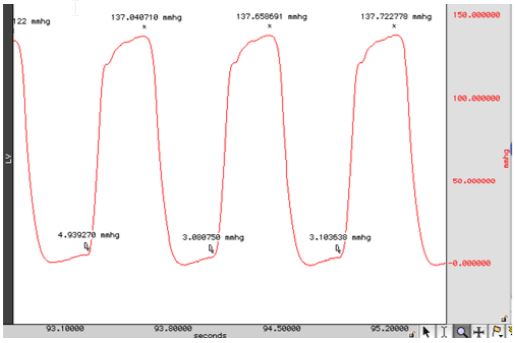
Operates on left ventricular blood pressure (LVP) data to define events at the systolic pressure and the left ventricular end diastolic pressure for each cycle:
Set up and recording is streamlined via intuitive hardware and software controls
AcqKnowledge software utilizes guided channel setting dialogs, allowing the user to easily configure all channel data types and parameters. Once parameters are established, recording settings can be saved as a graph template for future use. This allows for instant start up for subsequent recording sessions.
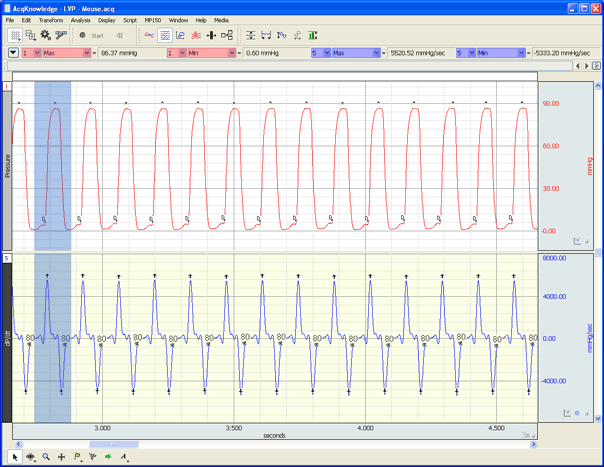
Left Ventricular Pressure data with calculated dP/dt waveform in AcqKnowledge
During recording, see real-time live raw data as well as real-time filtering or calculation channels. Display Rate, dp/dt, systolic, and diastolic pressure in real-time during recording, or choose from a variety of other filter and calculation settings. Easily insert markers for different stimuli presentation or experimental conditions throughout recording.
Physiological data can also be synchronized to video recording via BIOPAC Camera Systems. With Camera Systems physiological data and Video Data are time linked in AcqKnowledge. Simply scroll through either the video or physiological data to be taken to the corresponding data point in the other file.
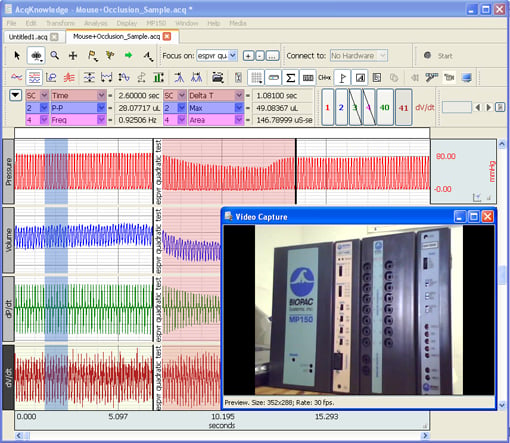
Synchronize Physiology with Video Data in AcqKnowledge
After recording, take advantage of fully-automated hemodynamic analysis routines in AcqKnowledge. Use guided video tutorials to get the most out of all available analysis tools.
Arterial Blood Pressure Automated Analysis Package Overview
ABP Classifier & Analysis
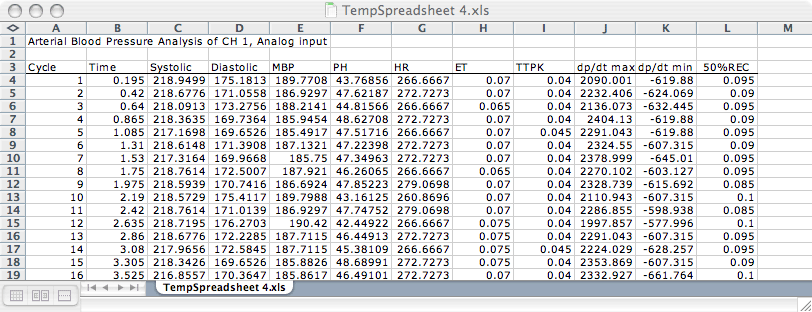
Use this analysis routine to automatically place systolic and diastolic events on ABP signal. Use with invasive or noninvasive recordings! Get relative Q measures by also incorporating a Lead II ECG signal. Analysis extracts cycle-by-by-cycle measurements from the data.
Arterial BP and Left Ventricular BP Analysis Measurements include:
- dP/dt Max
- dP/dt Min
- Minimum pressure
- QA Interval
- Recovery time
- Diastolic pressure
- Systolic pressure
- Heart rate
- Pulse Height (PH) — also called Pulse Pressure
- Recovery Interval
- Tau (LVP)
- Tension time index (LVP)
- Ejection time (ABP)
- Mean blood pressure (ABP)
- Time to peak pressure (ABP)
Left Ventricular Pressure Classifier and Analysis
Interested in Ventricular Pressure? AcqKnowledge also includes automated routines for LVP analysis! The Left Ventricular Pressure Analysis routine automatically locates systolic and end diastolic events on LVP signal. LVP Classifier first places markers and values on the waveform and then the full analysis extracts cycle-by-by-cycle measurements from the data.
Extracted measures include:
- Contractility index
- Developed pressure
- dP/dt Max
- dP/dt Min
- End diastolic pressure
- Minimum pressure
- QA Interval QA
- Rate – heart rate in BPM
- Recovery time
- Systolic pressure
- Tau
- Tension time index
Get Started!
Contact BIOPAC today to customize your package with amplifiers, leads, electrodes, and/or transducers.
- View available MP Research Starter Systems
- Purchase a standalone copy of AcqKnowledge for Windows or Mac

Stay Connected