

MODIFIABLE EYE-TRACKING EXPERIMENT
Comprehensive eye tracking solution for accomplishing common eye tracking tasks with the following modifiable features:
 Utilize a GUI or code based interface for setting up an eye tracking experiment
- Add environments and target objects of your choosing
- Add 360 video or images (mono or stereoscopic)
- Adjust fixation time
- Enter participant data
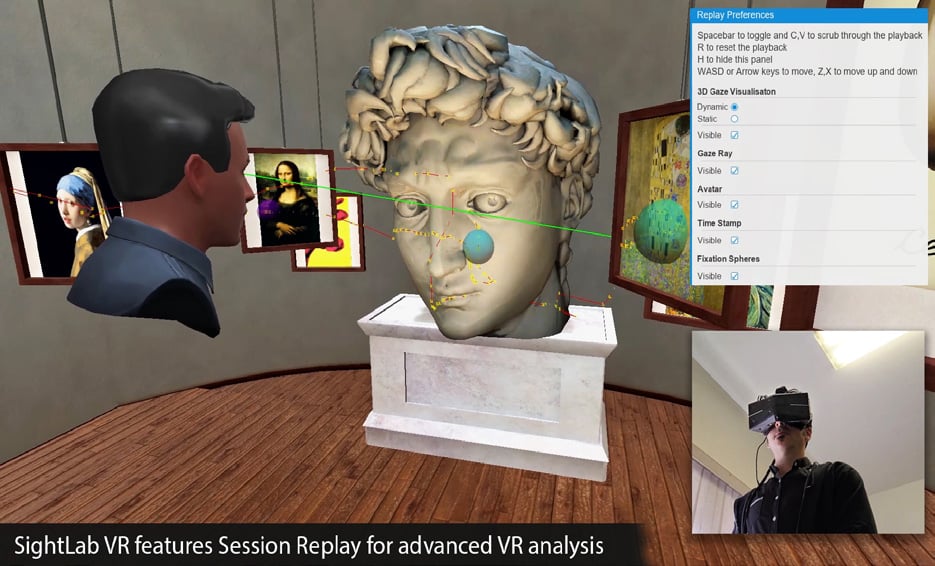
- Record and replay VR sessions with advanced analytics overlays
- 3D Gaze Path visualization
- Fixation Spheres
- Gaze Ray and intersect points
- Fixations
- Collect eye tracking data and write to a .txt or .csv file with the following parameters
- Timestamp
- Pupil intersect x,y,z position
- Pupil Diameter
- Eye Openness
- Fixations
- Custom Flags
- Write stats to file including
- Views per object
- Total view time per object
- Average view time per object
- Object timeline
- Calibrate user with 5 to 9 point calibration
- Toggle a gaze intersection point
- Display fixations in real time along with a timestamp
- Record video of experiment for later review
- Add custom flags to synchronize with events in the simulation
- Add custom events to a fixation for gaze based interactions
- Modify hardware setup to allow for various tracking devices and inputs
- Choose from various avatars (male or female)
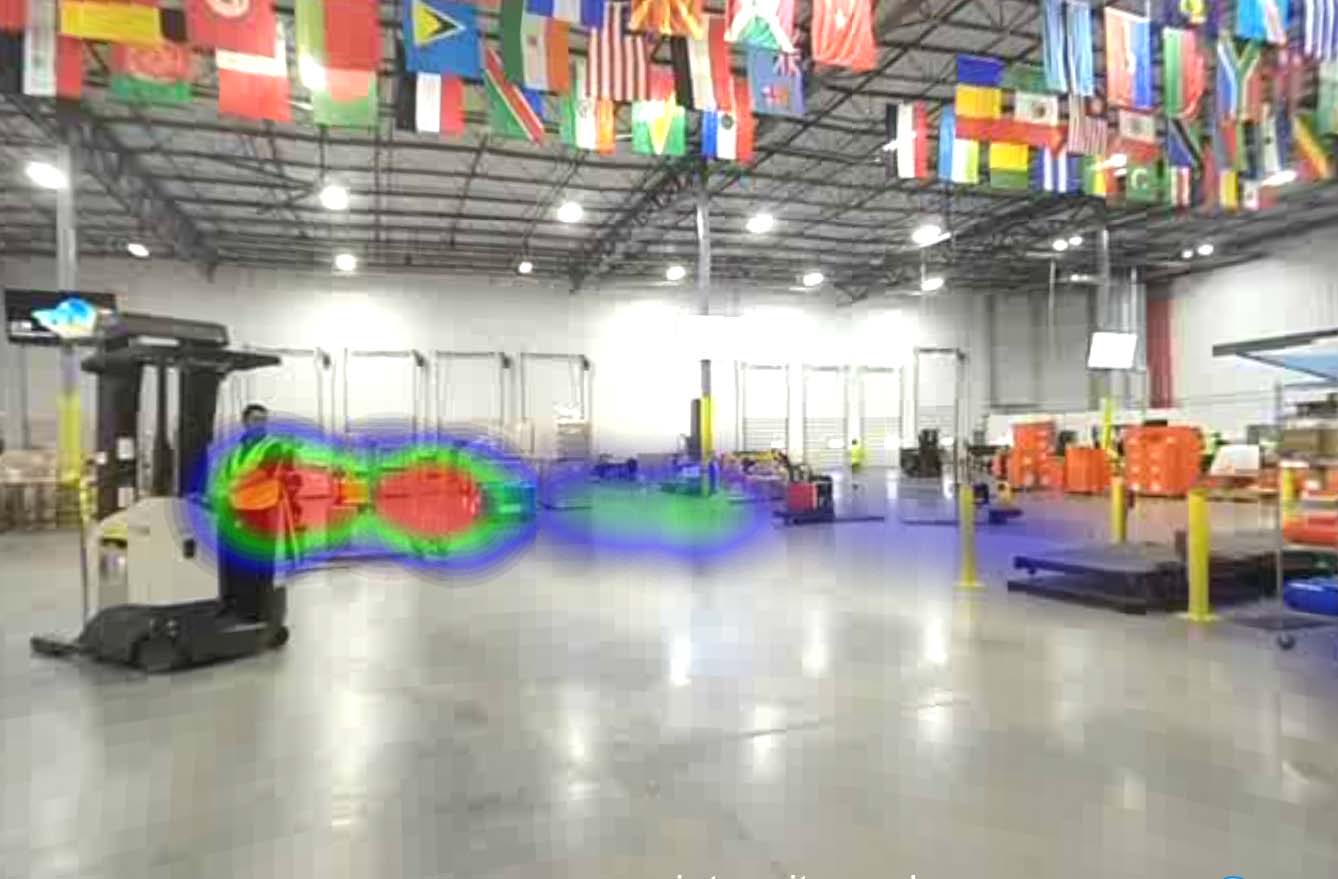
HEATMAP
- Record gaze point data, generate a heatmap, and display a saved heatmap.
ADDITIONAL SUPPORT
Access to eye tracking related support email ticketing system (up to 3 hours of engineering time per support case, max. 12 hours per contract per year)* Note: Includes 1 year of support as described above. Additional years can be purchased separately. This support does not cover the Vizard license.
Product Family
Product Type
Product Options
Capture User Behavior
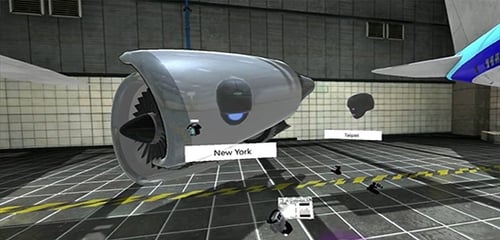
In virtual reality eye-tracking studies, users react naturally to their virtual environments, performing immersive tasks while researchers gain insight by tracking where users are looking and when.
Gain Behavioral Insights
Precise data (eye movement, objects of interest, fixation time, etc.) and real-time data visualizations (user heat maps and gaze paths) can help researchers analyze users’ decisions.
Improve Your Research
Put user attention and decision making at the center of your study. See exactly how a user visually assesses their environment and understand why they make certain choices.

Stay Connected