AcqKnowledge software utilizes guided channel setting allowing the user to easily input recording channel data. Once parameters are established, recording settings can be saved as a graph template for future use. This allows for instant start up for subsequent recording sessions.
During recording, see real-time live raw GSR data as well as real-time filtering or calculation channels including High-pass filtered/AC Coupled GSR. Easily insert markers via the computer keyboard for different stimuli presentation or experimental conditions throughout recording. Markers can also be inserted by stimulus presentation programs such as E-Prime or SuperLab using the isolated digital interface (STP100C) or by digital handswitches.
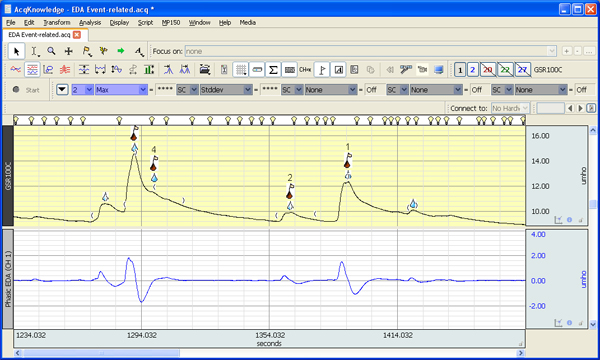
GSR (EDA) Data in AcqKnowledge
GSR and other physiological data can also be synchronized to video recording via BIOPAC Camera Systems. With Camera Systems, GSR data and Video Data are time linked in AcqKnowledge. Simply scroll through either the video or physiological data to be taken to the corresponding data point in the other file.
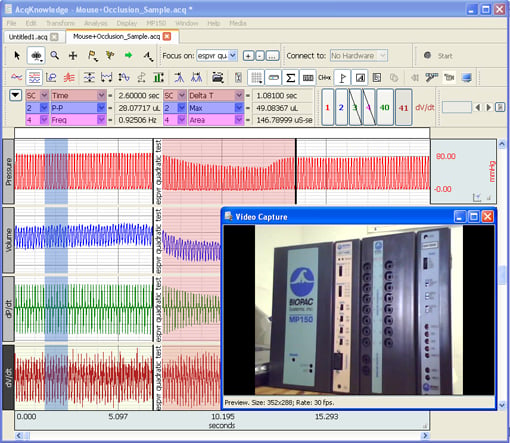
Physiology and Linked Video Data
After recording, take advantage of fully automated GSR analysis routines in AcqKnowledge. Use guided video tutorials to get the most out of all available analysis tools.
GSR Automated Analysis Package Overview
The Galvanic Response Data analysis routines are separated into three menu options that transform the tonic (raw) GSR signal to create a phasic (AC coupled) waveform, locate and score skin conductance responses, or perform a detailed event-related GSR analysis by combining marker information from the Stimulus-Response: Digital Input to Stim Events routine to the event-related GSR Analysis routine. The Event-related routine will automatically derive the phasic waveform and locate SCRs.
Locate Skin Conductance Responses (SCRs)
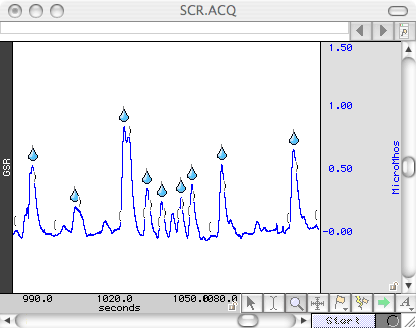
Identify skin conductance responses and score them on the waveform. Use this analysis to analyze spontaneously occurring skin conductance responses.
Event Related GSR Analysis
This routine locates skin conductance responses (SCRs) on the GSR waveform that are associated with stimulus delivery events. Markers are inserted on the graph to allow for further data analysis around the SCR positions. The Analysis routine then outputs a summary table of specific vs non-specific SCRs and corresponding measurements for each response.
Additional options for multiple stimulus event types and unmatched events are available, including:
- Labels and additional measures in the specific stimulus and SCR analysis table
- Text and Excel tables may be optionally sorted either by time or grouped by stimulus label
- Table listing stimulus events that were not paired with an SCR
- The SRR/NS.SSR Rate analysis, which counts frequencies of SCRs in specific time periods, can be driven by time periods defined using pairs of events or a selection in the graph
- Table listing amplitude/frequency percentage statistics for all matched and unmatched stimuli events (e.g. total stimulus count, percentage of stimuli that were pared with an SCR, etc.)
- Specific-SCR events may be defined on the tonic GSR waveform at the positions of specific SCRs with labels matching the stimulus to which they correspond. (This allows for further peak-detector based runs to perform additional data reduction.)
See the Event Related GSR Analysis in action:
Additional Tools for Recording GSR in the MRI
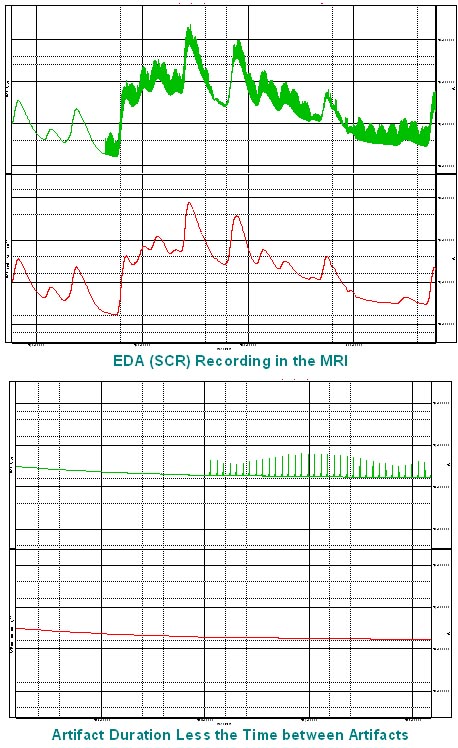
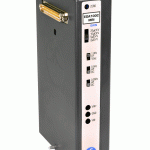
Record GSR data in the MRI by adding on specialized MRI Smart Amplifiers. The EDA100C-MRI amplifier and cable/filter set allow for cleaner GSR data recordings in the MRI environment. After recording, take advantage of automated MRI data processing tools in AcqKnowledge.
Get Started!
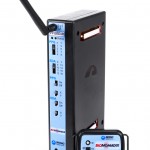
Record up to 16 channels of high-fidelity GSR and other physiological data either wirelessly with BioNomadix or via standard wired amplifiers. Contact BIOPAC today to customize a complete package with amplifiers, leads, electrodes, and/or transducers for your application.
- View available MP Research Starter Systems
- Purchase a standalone copy of AcqKnowledge for Windows or Mac

Stay Connected