The algorithm conforms to the frequency domain algorithm guidelines as published by the European Heart Journal. For optimal results, follow these suggestions for Preparing HRV Data for Analysis.
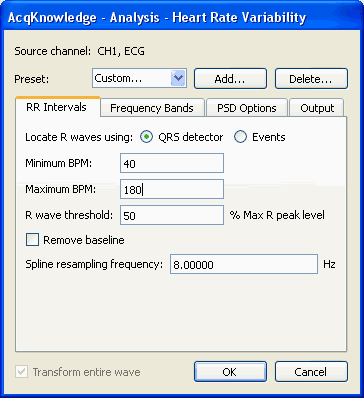
- There are two methods for extracting the RR intervals from the ECG signal:
- A modified Pan-Tompkins QRS detector
- Events located in the file – ECG QRS Peak event
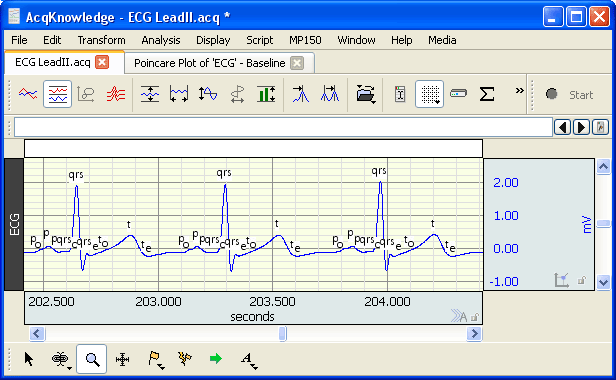
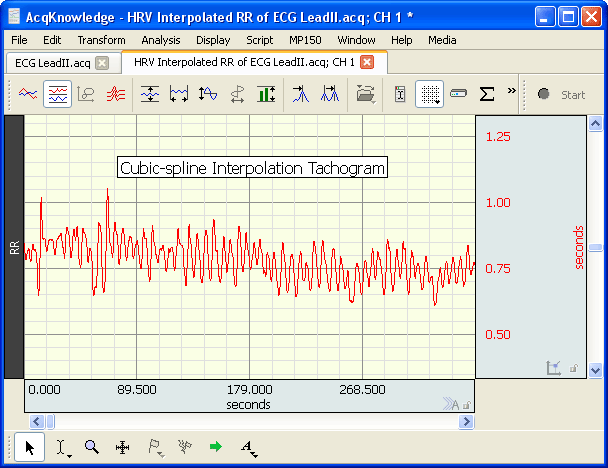
- The RR intervals are re-sampled to a continuous sampling rate in order to extract frequency information.
- Cubic-spline interpolation is used to generate this continuous time-domain representation of the RR intervals.
- The frequency information is extracted from the RR intervals and analyzed to produce standard ratios. Power sums are reported in units of sec2/Hz. A Welch periodogram is used to generate the Power Spectral Density (equivalent to Transform > Power Spectral Density).
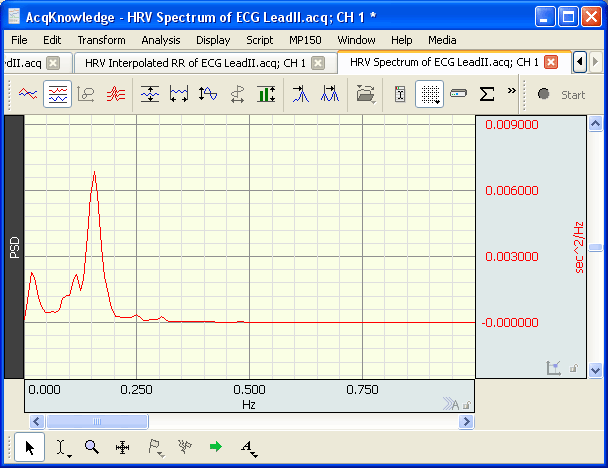
- The software reports values for the typical HRV frequency bands, including: Very Low Frequency, Low Frequency, High Frequency, and Very High Frequency ranges. The analysis also includes values for the overall ratios: Sympathetic, Vagal and Sympathetic – Vagal balance. The ratio values and frequency band results can be plotted into a Journal file or exported for further analysis.
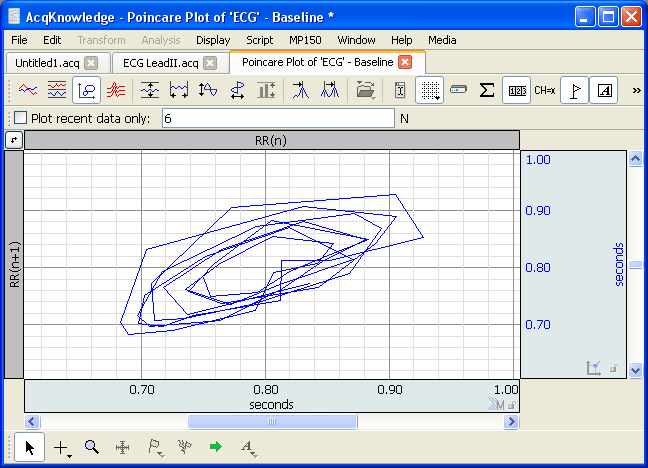
AcqKnowledge also inlcudes a Poincare plot option that will display either selected areas of the data, or the entire file. The Poincare plot is an X/Y plot of the RR intervals in seconds. One axis displays the RR interval and the other axis displays the interval delayed by one beat.



Stay Connected