
Drill down your data with the Argus Science ETAnalysis StimTrac Module intuitive project based format and reduce your participant data to a series of fixations. Fixations on background images can be presented in size, number, or in duration. These fixations will be automatically assigned to your designated AOI.
As with the entire suite of Argus Science ETAnalysis software, Argus Science ETAnalysis StimTrac Module quickly outputs statistics for a single participant or a large group. It has many useful tools to examine and plot raw data, associate scene images with related segments of gaze data, and define area of interest (AOI) on both static and dynamic images. These built-in tools make it simple to arrange the statistics in user-definable charts and create compelling graphical representations such as scan paths, heat maps, SWARM™, etc.
Argus Science ETAnalysis StimTrac Module eliminates the disadvantage of using a head mounted eye tracker when a remote eye tracker is recommended by outputting gaze data on a separately recorded stimulus. The software automates the time consuming process of viewing individual video frames to manually position each AOI.
Fast and Convenient Tools—Statistical fixation data is quickly available via informative graphic displays. Bar plots include: total amount of time in each AOI, percent of time in each AOI, number of fixations in each AOI, average fixation duration, total fixation time, time to first fixation, and average pupil diameter in each AOI
Features
- Easy Analysis of Mobile Device Activity
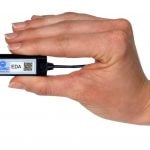
- Total Synchronization with EEG and EDA
- Save Funding Dollars–Two Eye Trackers in One
- Present Experiment on iPhone and iPad
Stay Connected