


FaceReader Software
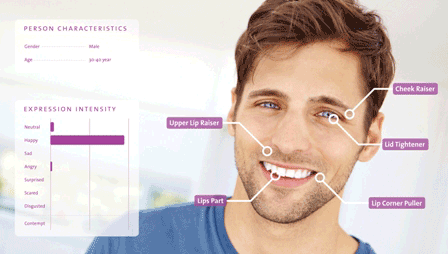
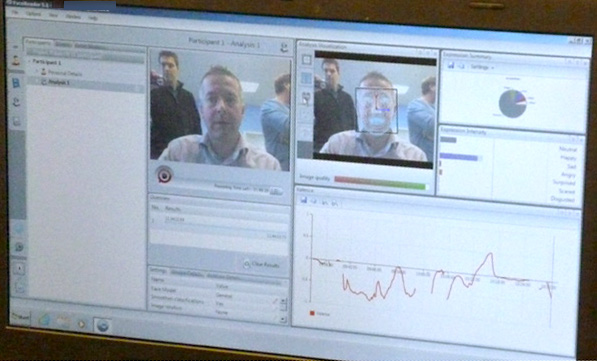
Emotions affect everyone in daily life, and play a key role in non-verbal communication. They are also essential to understanding human behavior. FaceReader easily and reliably delivers participant emotion analysis. Facial expressions can be visualized as bar graphs, in a pie chart, and as a continuous signal. A gauge display summarizes the negativity or positivity of the emotion (valence). The timeline provides a detailed visual representation of the data. A separate reporting window displays a pie chart with percentages, a smiley, and a traffic light, indicating whether a person’s mood is positive, neutral, or negative. All visualizations are available in real-time and may be viewed afterward.
FaceReader runs on Windows only and current release 7.1 is supported on Windows 7 64 bit (SP 1) or Windows 10 (64 bit).
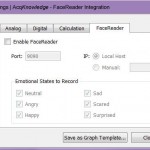
Integrating with BIOPAC
Choose a license add-on for AcqKnowledge 5 to integrate FaceReader 7.0 (FR-INTERFACE) or the complete MP160 System with FaceReader Integration License (MP160WSW-FR).
Action Unit Module


AU 9. Nose Wrinkler – AU 6. Cheek Raiser – AU 14. Dimpler
Action Units are the actions of individual muscles or groups of muscles. This add-on module allows for automatic analysis of a selection of 20 commonly Action Units (such as raising of cheeks, wrinkling of nose, dimpling, and lip tightening) to measure affective attitudes (such as interest, boredom, and confusion) and monitor combined activation/non-activation of specific Action Units—for instance, the emotional state confusion is correlated with either Action Unit 4 (Brow Lowerer) or 7 (Eyelid tightener).
- Curious what Action Units actually look like? See FaceReader Facial Action Units.
When an action is active, its intensity is displayed in 5 categories: Trace (A), Slight (B), Pronounced (C), Severe (D), or Max (E). Output is presented on this scale with different colors and can be exported for further analysis in Excel, The Observer XT, or another program of your choice.

Action Units are responsible for facial expressions.
Detecting boredom, confusion, and interest
FaceReader 7.1 introduced the analysis of three commonly occurring affective attitudes: interest, boredom, and confusion. Unlike regular facial expressions, these affective attitudes are computed over a window of time (typically 2-5 seconds), rather than per time frame. In addition, some of these affective attitudes also take into account certain additional facial cues like nodding or head shaking, that are also internally computed over the analysis history.
These affective analyses are available on an experimental basis.

Confusion is one of the affective attitudes that is now available on an experimental basis.
Project Analysis Module
The Project Analysis Module can be used for advanced analysis and reporting. With this module, you quickly gain insight into the effects of different stimuli. With the new version of FaceReader, you can now use images as a source of a stimulus as well!
Version 7 allows you to compare responses to different video stimuli in one view, offering faster insights into the effects of stimuli.
Independent variables
Selections of participants can easily be made automatically or manually, for example, by selecting all female test participants and comparing their responses to different commercials. You can also add independent variables such as educational level or previous knowledge level, which allows you to make groups (female with high education level) and compare results between the groups you have created.

Numerical analysis in FaceReader – compare groups.
Analysis
The Project Analysis Module offers a number of different analysis and reports:
- Temporal Analysis – this type of analysis is based on a group response toward a single stimulus. The average response of the group can be viewed side-by-side with the stimulus video, the participant videos and line-charts of the absolute and relative average expression, arousal and valence. The results can also be presented as a pie chart. When the stimulus includes audio, this is also audible when reviewing your results.
- Numerical Analysis – averages and standard deviations of the responses to stimuli and event markers can be viewed in tables, bar charts, and box-plots. All graphs can be saved as a picture for presentation purposes.

Analyze with a T-test which facial expression intensities differ significantly between this participant group and the other participant group.
Visual presentation of your data
The Project Analysis Module can create multiple visual presentations of your data, including:
- An individual line graph shows the intensity of the recorded emotions and can be displayed in sync with the video of the test participant and the stimulus, giving you a complete overview.
- When working with multiple test participants, a summary line graph can be displayed and synchronized with the stimulus providing a solid impression of the overall responses.
- A pie chart which shows a summary of results of multiple test participants based on your own (marker) selection. Choose a pie chart of combined line graphs, whatever provides you with the best overview.
- Box plots per emotion of the results of all test participants per stimulus are a real visual aid in determining which emotion prevailed on which stimulus.
- All graphs can be saved as a picture for presentation purposes. Output (log files) can be exported to a program of your choice, such as Excel or The Observer XT.
Product Family
Product Type
Seamless integration
Easily integrate and synchronize physiological data or eye tracking through AcqKnowledge
Complete facial expression analysis
Delivers objectivity in observations
Accurate modeling of the face by describing 500 key points delivers. Action Units available.
Useful for a variety of applications
Psychology, educational research, consumer behavior research, usability studies, neuromarketing, etc.
Stay Connected