L11A Reaction Time II – Visual Stimulus
The lesson demonstrates the effect of learning and physiological processes on reaction times to a visual stimulus.
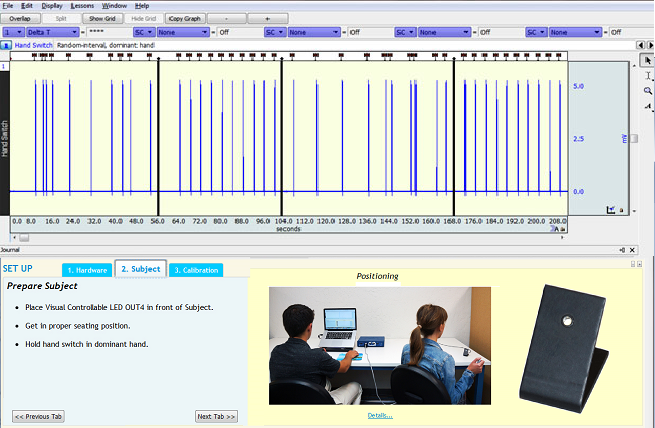
Students see two presentation schedules of visual LED stimulation. The Subject presses a pushbutton hand switch as quickly as possible after seeing the LED blink.
Students can then perform a statistical analysis of the results including: group mean, variance and standard deviation.
Experimental Objectives
- Observe the effect of learning and the effect of anticipating the stimulus delivery on reaction time.
- Compare reaction times in four stimulus-response situations:
a) Fixed interval stimulus presentation using the dominant hand for the response
b) Random interval stimulus presentation using the dominant hand for the response.
c) Fixed interval stimulus presentation using the nondominant hand for the response.
d) Random interval stimulus presentation using the nondominant hand for the response. - Compare the reaction times for groups of subjects by calculating the statistics of group mean, variance, and standard deviation in each of the four stimulus-response situations.
- Compare the visual stimulus reaction times to the auditory stimulus reaction times obtained in Lesson 11 (Reaction Time I).
Tasks Performed by the Student
BSL Lessons are designed to allow at least four students to record and save data in a normal lab period (60-90 minutes). Typically, labs work most efficiently with three or more students working together at each BSL station.

- React to a schedule of fixed interval LED blinks using dominant hand on pushbutton, then repeat using non-dominant hand.
- React to a schedule of random interval LED blinks using dominant hand on pushbutton, then repeat using non-dominant hand.
Add active learning segments designed by students or instructor to expand this lesson.
Videos
Biopac Student Lab Student Download
Lesson Hardware
This lesson requires a Biopac Student Lab (BSL) System and the following hardware. If your BSL System does not include all hardware items, expand your system by selecting required items below. For more details, review the Lesson: L# BSL Lessons - see the Lab Manual or launch BSL; A# and H# BSL PRO Lessons, click the PDF link above to review full setup, recording, and analysis procedures.
| Item | Name | Cart |
|---|---|---|
| OUT4 | Visual Stim LED via Analog out | Add to Cart |
| SS10L | Push Button Hand Switch - MP3X/45 | Add to Cart |
Stay Connected