Signal Analysis and Processing – BME

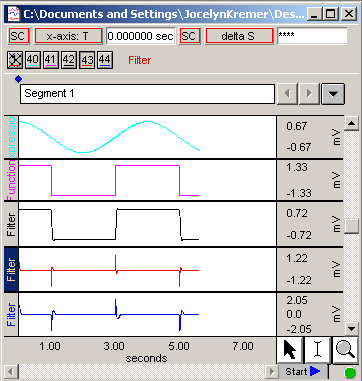
The BSL software has an extensive library of signal processing functions permitting graphical insight to analytical methods. The software can demonstrate the procedure and consequences associated with simple to complex signal processing methodologies. For example, students can view data before and after IIR or FIR filter processing, build a complex waveform from periodic signals (i.e., create a square wave from multiple sine waves) and decompose the result, or apply non-linear processing methods to data. Use the X/Y display mode to investigate Lissajous patterns and demonstrate phase relationships between two variables. Signals can be correlated an convolved. Use the histogram to focus on distribution of specific signal measures.
WHAT'S NEW
Biology research covers a wide variety of studies all aiming to understand living organisms...
Stay Connected